Projects
India and global projects in quantitative finance, portfolio construction, and systematic investing — sorted by newest first.
Each project applies quantitative methods to a specific problem in finance — from clustering-based portfolio construction and market regime detection to adaptive portfolio strategies and RRG-based rotation analysis.
Projects include interactive visualizations, source code links, and methodology explanations. Data is updated periodically via automated pipelines.
| 17. | 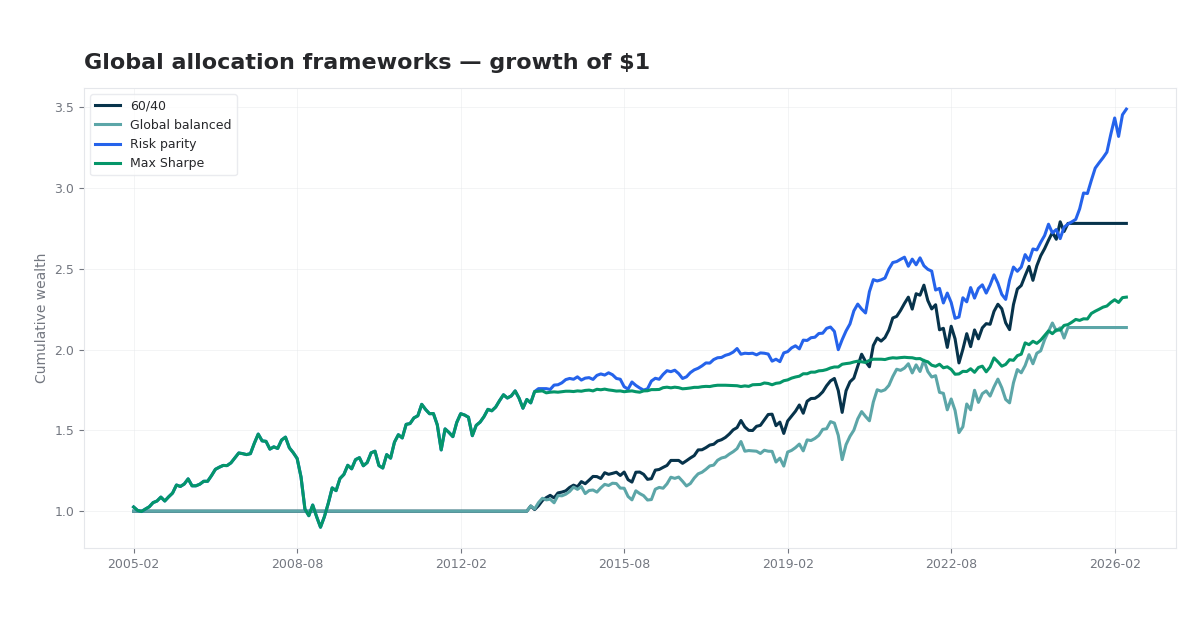 Global Multi-Asset Portfolio for the Next Decade
(2026 )
Institutional-style strategic asset allocation across 50+ global ETFs: eight frameworks from 60/40 to risk parity and max Sharpe, with factor attribution, regime splits, Monte Carlo paths, and crisis stress replay. Global ETFs · 60/40 vs diversified · risk parity · hypothesis tests · Monte Carlo |
| 18. | 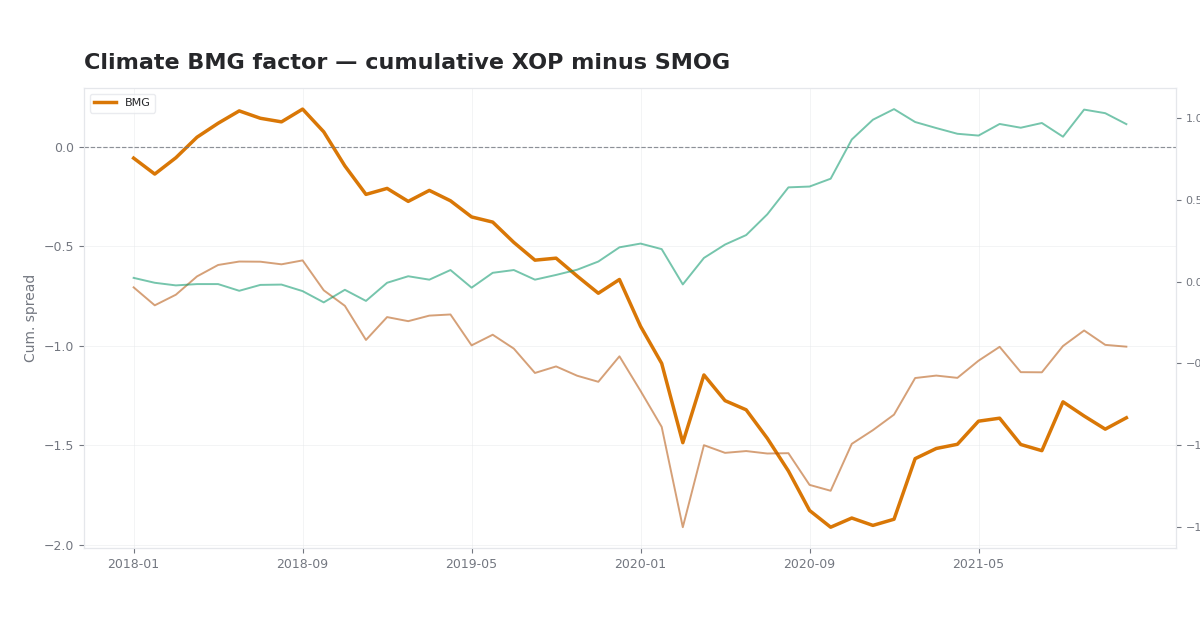 Climate BMG Factor Lab
(2026 )
Market-implied carbon risk: six nested factor models (CAPM through Carhart+BMG) on 30 US stocks with live Ken French factors and XOP−SMOG BMG from yfinance. BMG factor · climate beta · sector exposure · Carhart+BMG OLS |
| 19. | 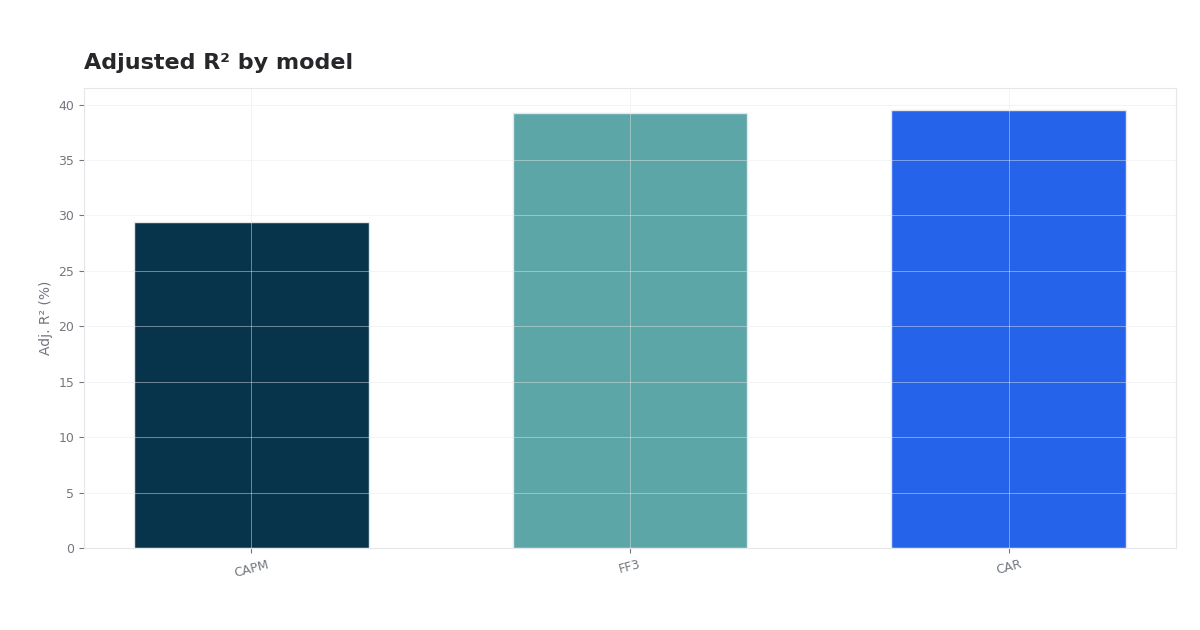 CAPM vs Fama–French vs Carhart
(2026 )
Goncharov (2023) replication: CAPM, FF3, and Carhart four-factor OLS on 30 US stocks (2018–2021) with Ken French factors. CAPM · FF3 · Carhart · adjusted R² · RSE tests |
| 20. | 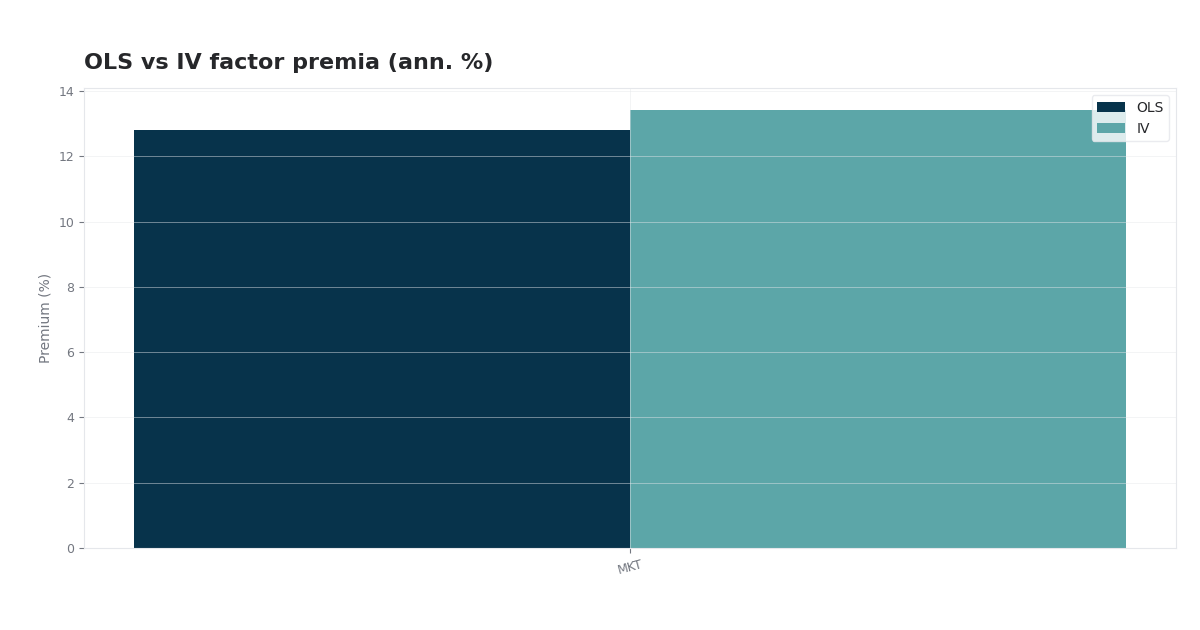 US IV Asset Pricing Lab
(2026 )
Jegadeesh-style IV asset pricing on US stocks: split-sample betas, Dimson adjustment, OLS vs. IV Fama–MacBeth premia (CAPM–FF5) with characteristic controls. IV · EIV bias · Ken French · individual stocks |
| 21. | 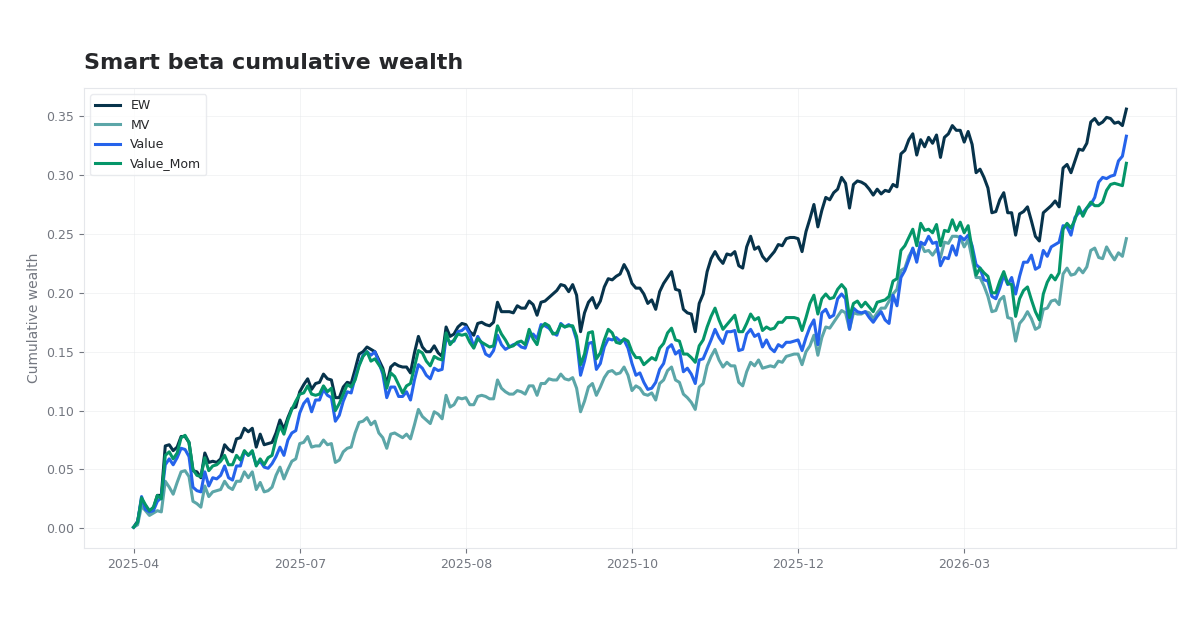 Smart Beta: Factor-Tilted Portfolio Construction
(2026 )
One-year rolling study on a sector-balanced U.S. equity panel: equal weight, min variance, value tilt, and value–momentum blend with full risk and factor analytics. Factor models, portfolio construction, risk analytics |
| 22. | 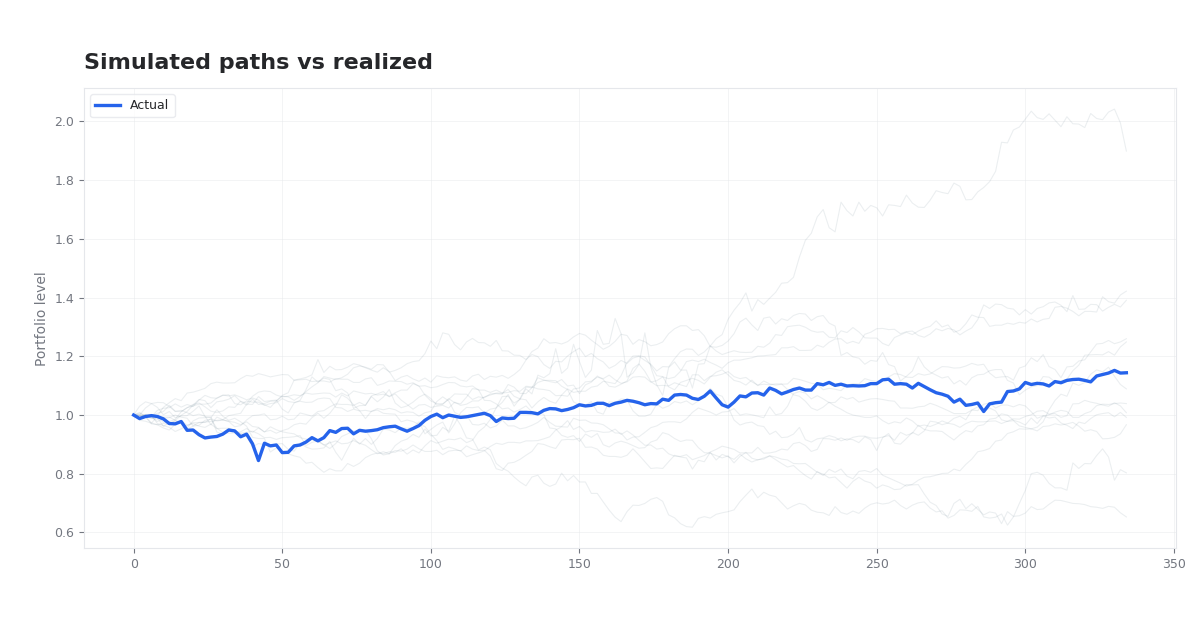 US Monte Carlo Portfolio Simulation (GARCH)
(2026 )
Multi-asset Monte Carlo paths with GARCH(1,1) volatility, Student-t shocks, and correlated residuals. Default 50/50 S&P 500 and Dow Jones vs realized performance. GARCH · Student-t · VaR/CVaR · US indices |
| 23. | 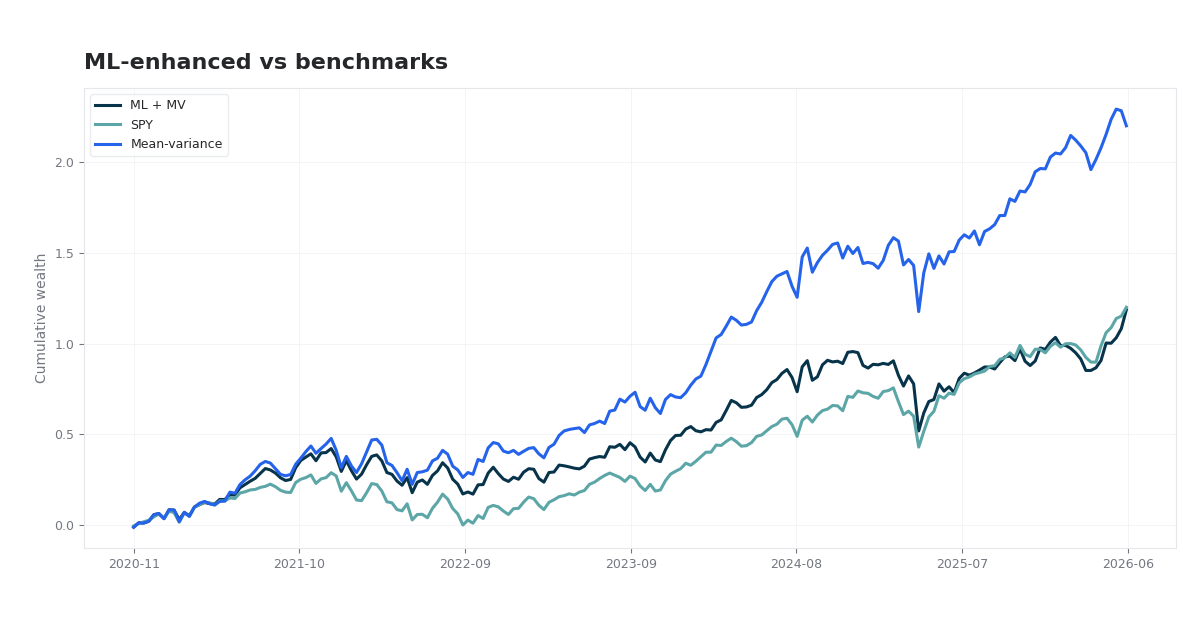 US ML-Enhanced Portfolio Optimization
(2026 )
ML-enhanced portfolio optimization on a 30-stock US panel: quarterly walk-forward backtests using mean-variance (MVO) with XGBoost return forecasts blended via Black-Litterman, evaluated against SPY with return, risk, and SPY-relative analytics (drawdowns, beta/alpha, VaR/CVaR, tracking error/capture, sector concentration, and ranked signals). MVO · XGBoost · Black-Litterman · SPY-relative risk · VaR/CVaR · Sector allocation |
| 24. |  Optimal Portfolio Rebalancing via Dynamic Programming
(2026 )
Sun et al. (MIT) optimal rebalancing on S&P 500 GICS sector sleeves — certainty-equivalent tracking error, Bellman partial rebalancing, and Monte Carlo comparison versus calendar and tolerance-band policies. Bellman DP · certainty equivalent · partial λ-rebalance · sector ETFs · Tables IV & VI |
Showing 17–24 of 40 projects