United States Research
US equity, options, and systematic research — indices, factors, and portfolio studies.
| 1. | 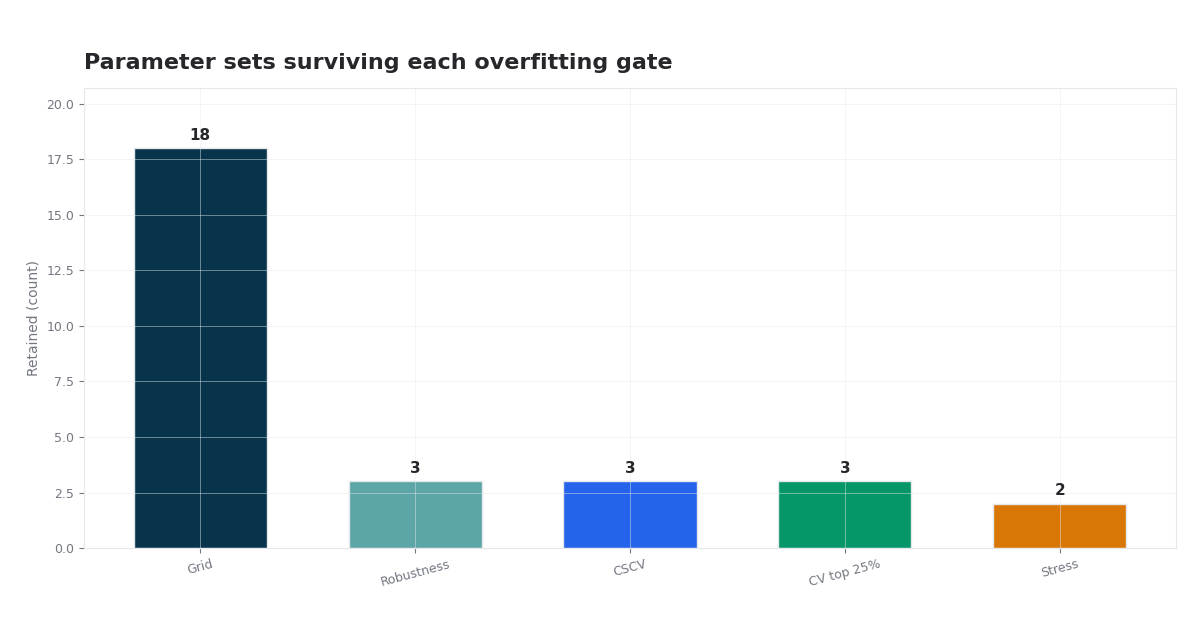 Detecting Overfitting in Momentum Strategies US (2026) Multi-stage overfitting diagnostics for S&P 500 J/K/N winners-only momentum: DSR, disparity, sensitivity, block bootstrap, CSCV/PBO, walk-forward CV, and stress-tested selection. J/K/N · Deflated Sharpe · CSCV/PBO · walk-forward · stress tests |
| 2. | 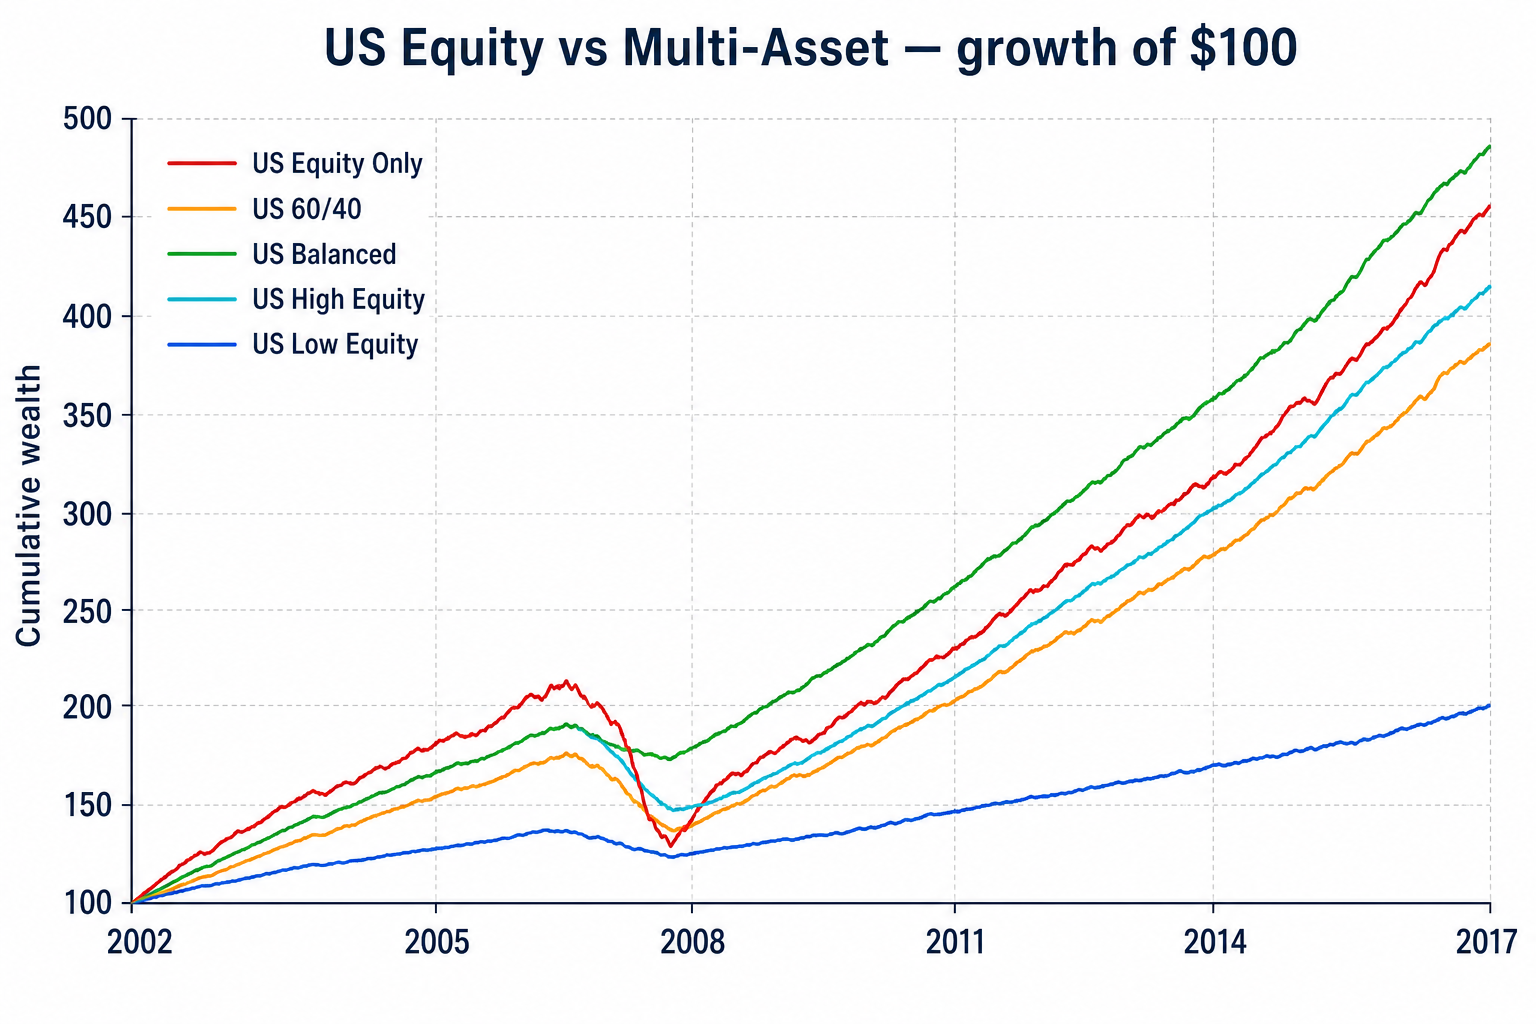 US Equity vs US Multi-Asset Risk-Adjusted Study US (2026) Comparative allocation study of US equity-only versus US multi-asset portfolios (stocks, bonds, REITs) with hypothesis testing, frontier diagnostics, and interactive risk-adjusted analytics. US equity · US bonds · REITs · Sharpe tests · drawdown tests · interactive diagnostics |
| 3. | 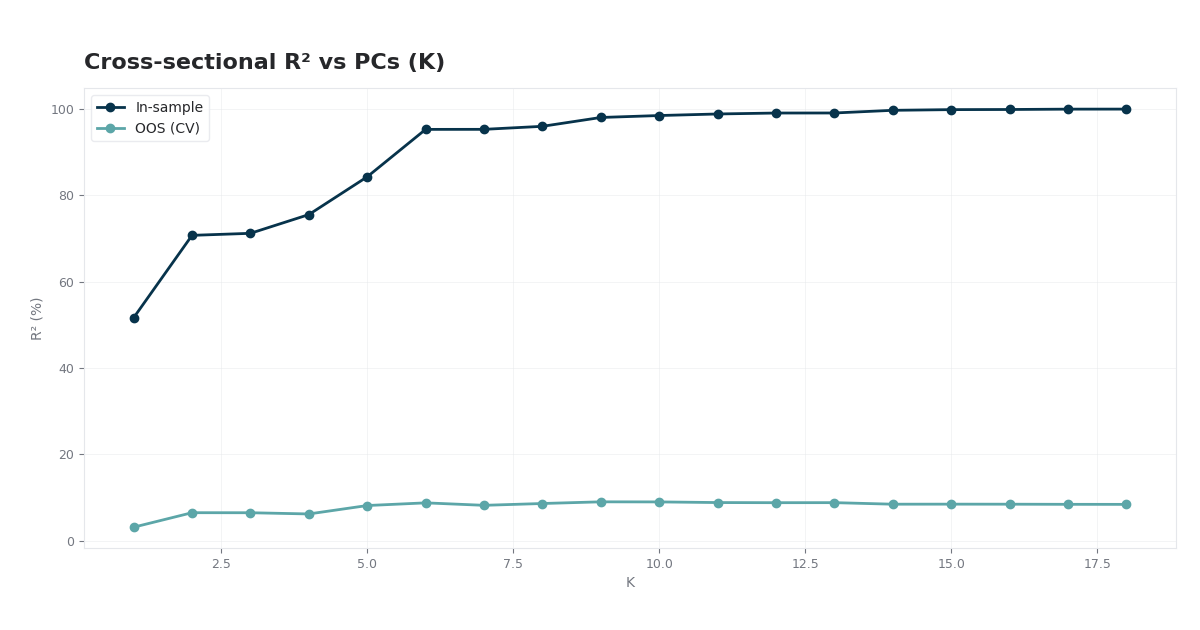 Cross-section shrinkage lab (ETF panel) US (2026) Yahoo Finance ETF panel: PCA spectrum, cross-sectional R² vs K, pseudo-OOS folds, ridge diagnostics. JSON from npm run data:shrinking-cross-section. Python, Recharts, PCA, shrinkage, cross-sectional R² |
| 4. | 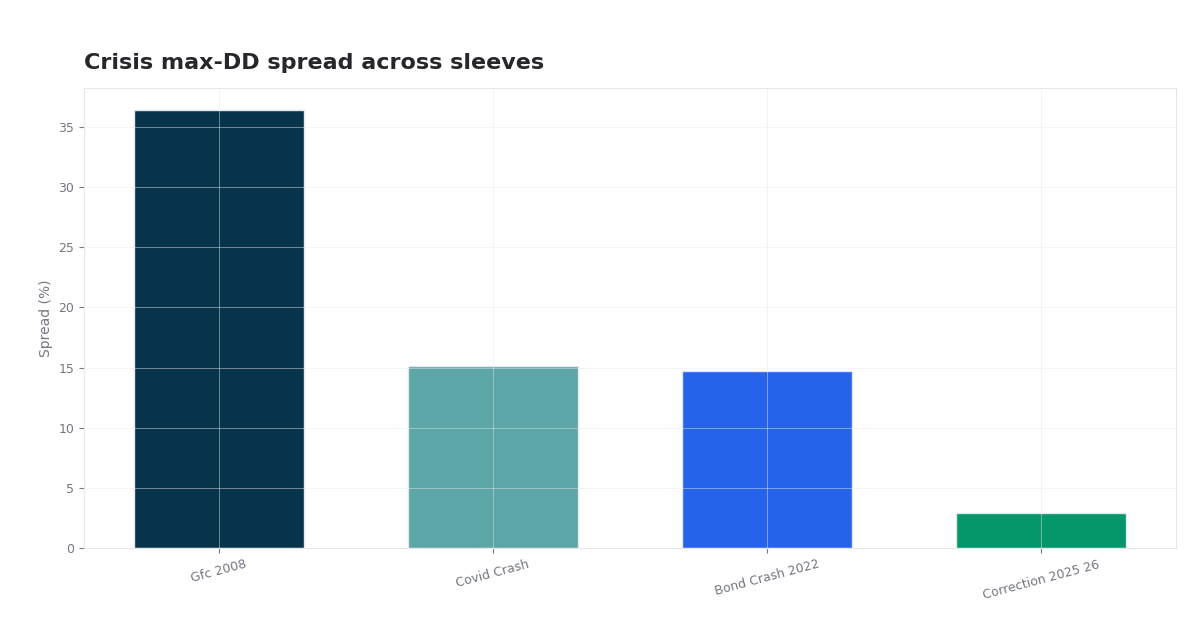 Portfolio Stress Lab US (2026) Institutional portfolio stress laboratory: historical crisis replay, univariate and compound parametric shocks, historical/parametric/Monte Carlo tail risk, Fully Flexible Probability reweighting, forward GARCH simulation, and cross-study tail-risk attribution. Crisis replay · compound stress · VaR/ES suite · FFP reweighting · regime correlation |
| 5. | 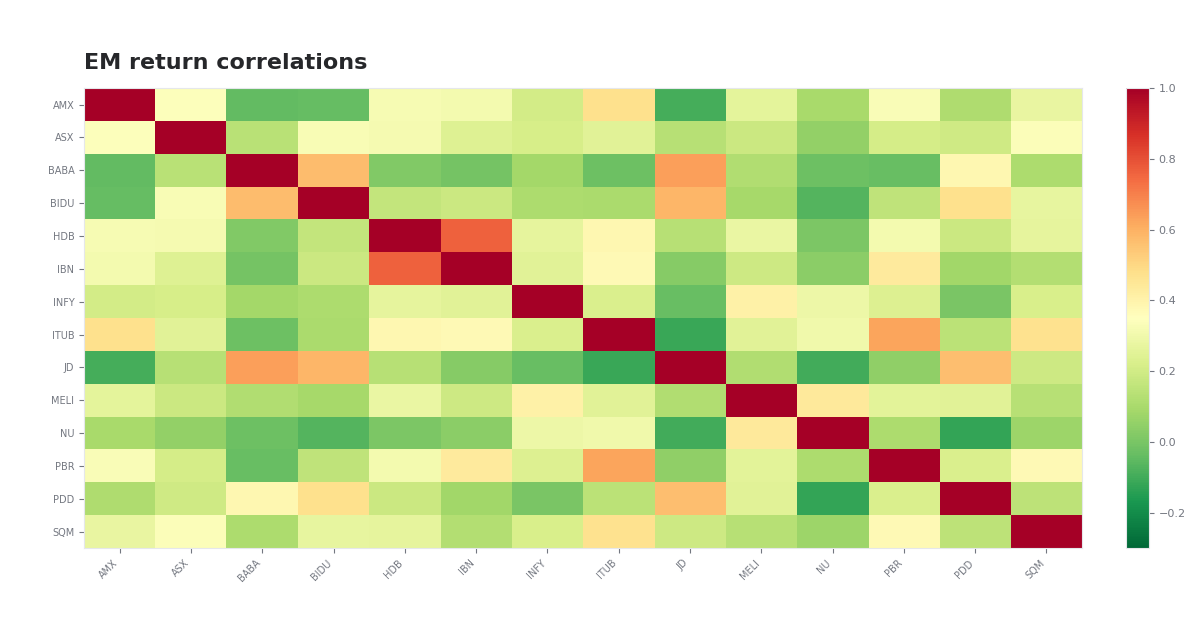 Emerging Markets Fundamental Portfolio US (2026) Multi-country EM equity framework: value/quality/risk/stability composite scoring, country–sector neutralization, constrained mean-variance optimization, correlation analytics, quintile monotonicity, and quarterly backtests vs EEM. EM fundamentals · MVO · correlation matrix · hypothesis tests · quintile analysis |
| 6. |  Market Homogeneity from Correlation Networks US (2026) Empirical US study of market-wide co-movement: monthly homogeneity index from correlation networks, regime analysis, SPY conditioning, and interactive network graphs. Correlation networks · homogeneity index · regime analysis · SPY overlay · network graphs |
| 7. |  Global Capital Flow Intelligence System US (2026) Multi-asset framework inferring global capital allocation from Yahoo Finance ETFs: eight flow engines, composite scores, regime detection, correlation networks, and flow-based portfolio backtests. Capital flow inference · 8 analytical layers · regime detection · flow portfolios · hypothesis tests |
| 8. | 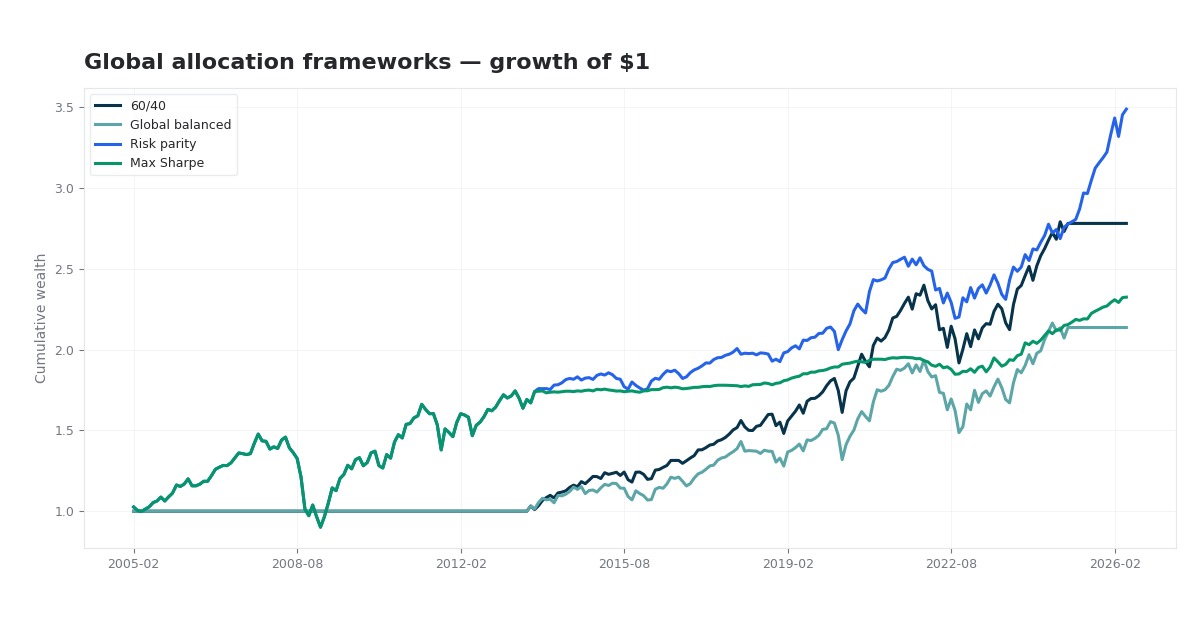 Global Multi-Asset Portfolio for the Next Decade US (2026) Institutional-style strategic asset allocation across 50+ global ETFs: eight frameworks from 60/40 to risk parity and max Sharpe, with factor attribution, regime splits, Monte Carlo paths, and crisis stress replay. Global ETFs · 60/40 vs diversified · risk parity · hypothesis tests · Monte Carlo |
| 9. | 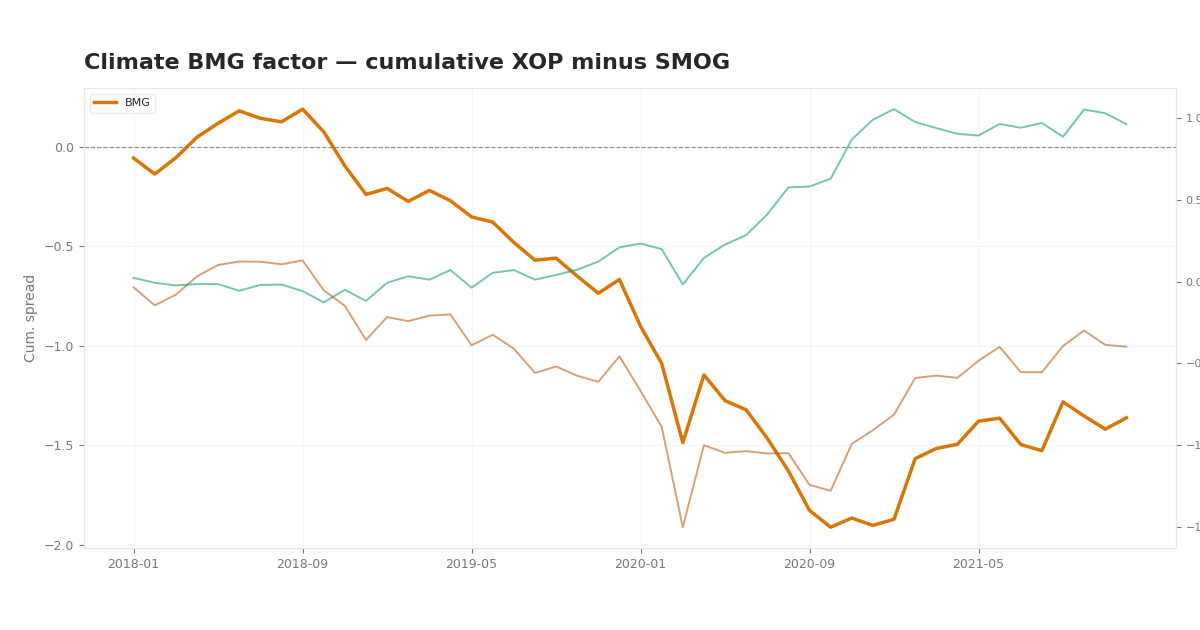 Climate BMG Factor Lab US (2026) Market-implied carbon risk: six nested factor models (CAPM through Carhart+BMG) on 30 US stocks with live Ken French factors and XOP−SMOG BMG from yfinance. BMG factor · climate beta · sector exposure · Carhart+BMG OLS |
| 10. | 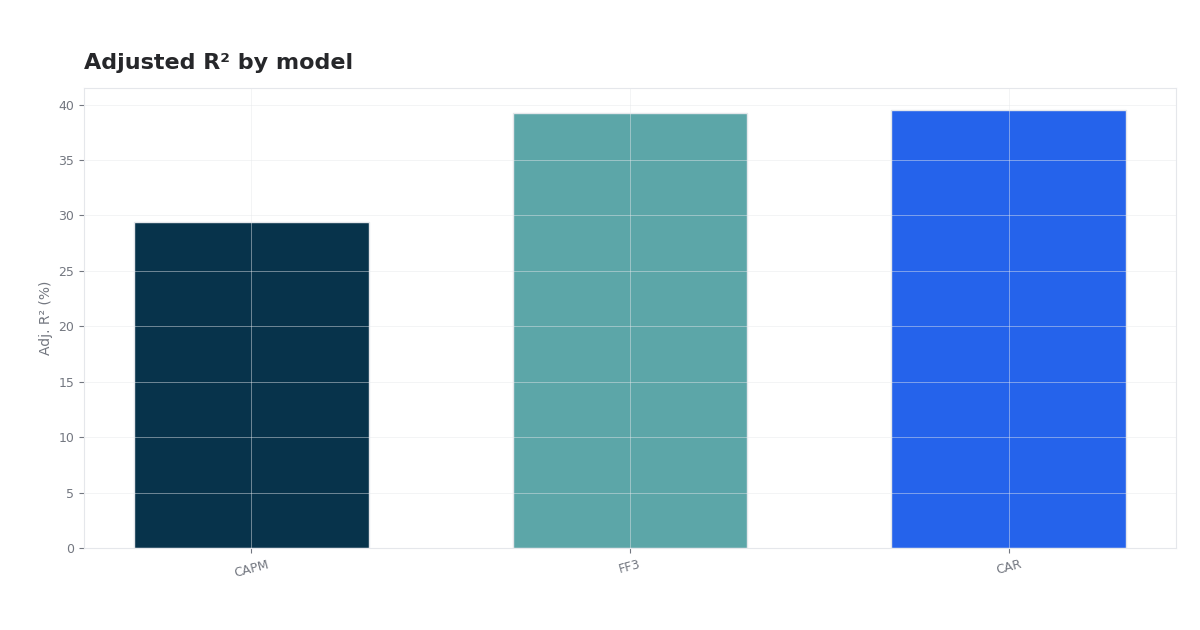 CAPM vs Fama–French vs Carhart US (2026) Goncharov (2023) replication: CAPM, FF3, and Carhart four-factor OLS on 30 US stocks (2018–2021) with Ken French factors. CAPM · FF3 · Carhart · adjusted R² · RSE tests |
| 11. | 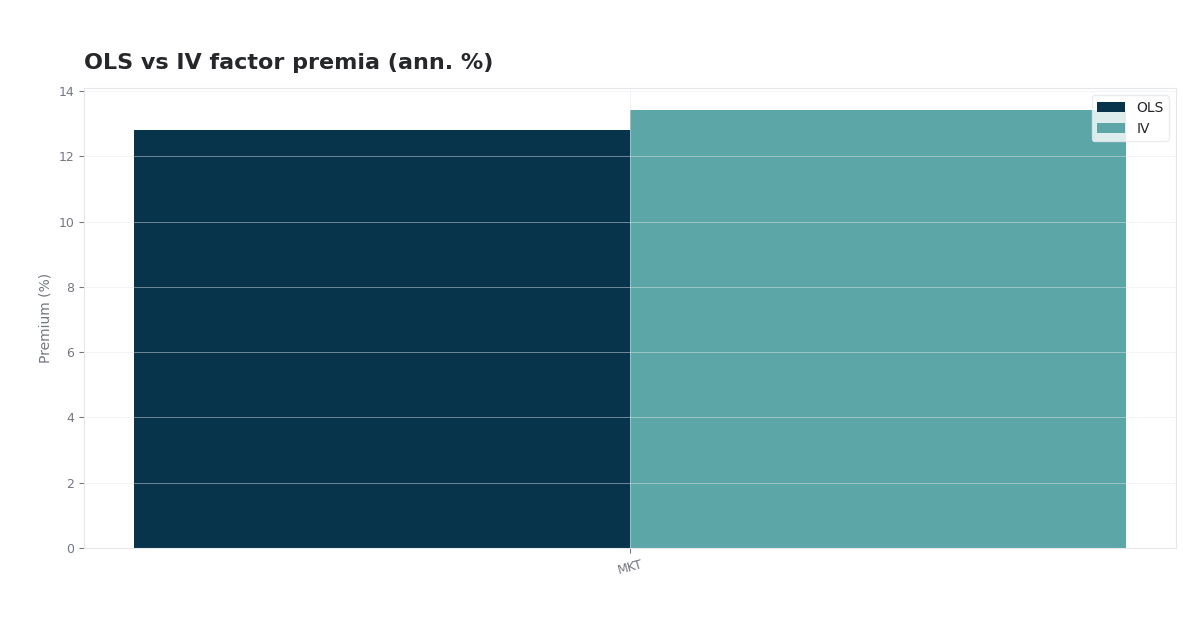 US IV Asset Pricing Lab US (2026) Jegadeesh-style IV asset pricing on US stocks: split-sample betas, Dimson adjustment, OLS vs. IV Fama–MacBeth premia (CAPM–FF5) with characteristic controls. IV · EIV bias · Ken French · individual stocks |
| 12. | 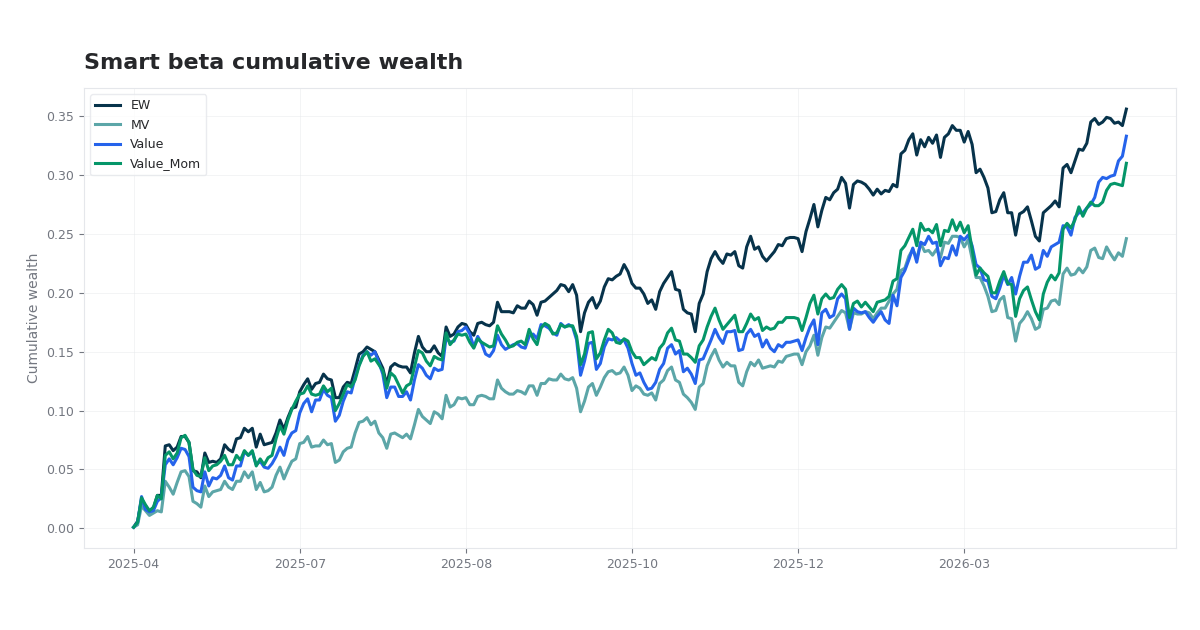 Smart Beta: Factor-Tilted Portfolio Construction US (2026) One-year rolling study on a sector-balanced U.S. equity panel: equal weight, min variance, value tilt, and value–momentum blend with full risk and factor analytics. Factor models, portfolio construction, risk analytics |
| 13. | 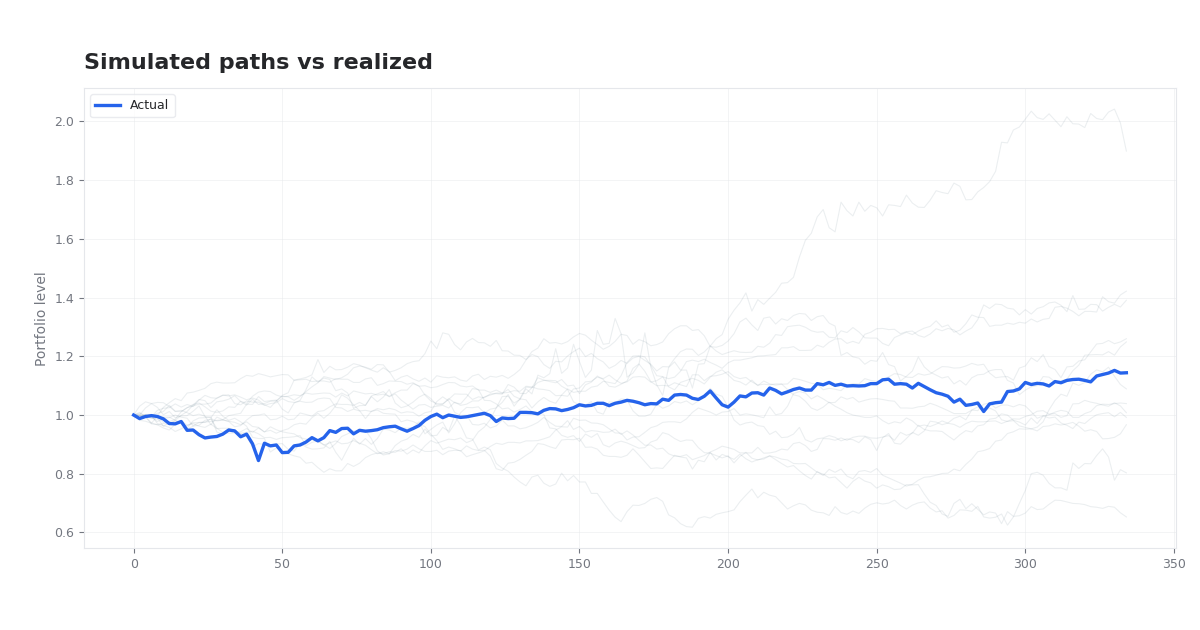 US Monte Carlo Portfolio Simulation (GARCH) US (2026) Multi-asset Monte Carlo paths with GARCH(1,1) volatility, Student-t shocks, and correlated residuals. Default 50/50 S&P 500 and Dow Jones vs realized performance. GARCH · Student-t · VaR/CVaR · US indices |
| 14. | 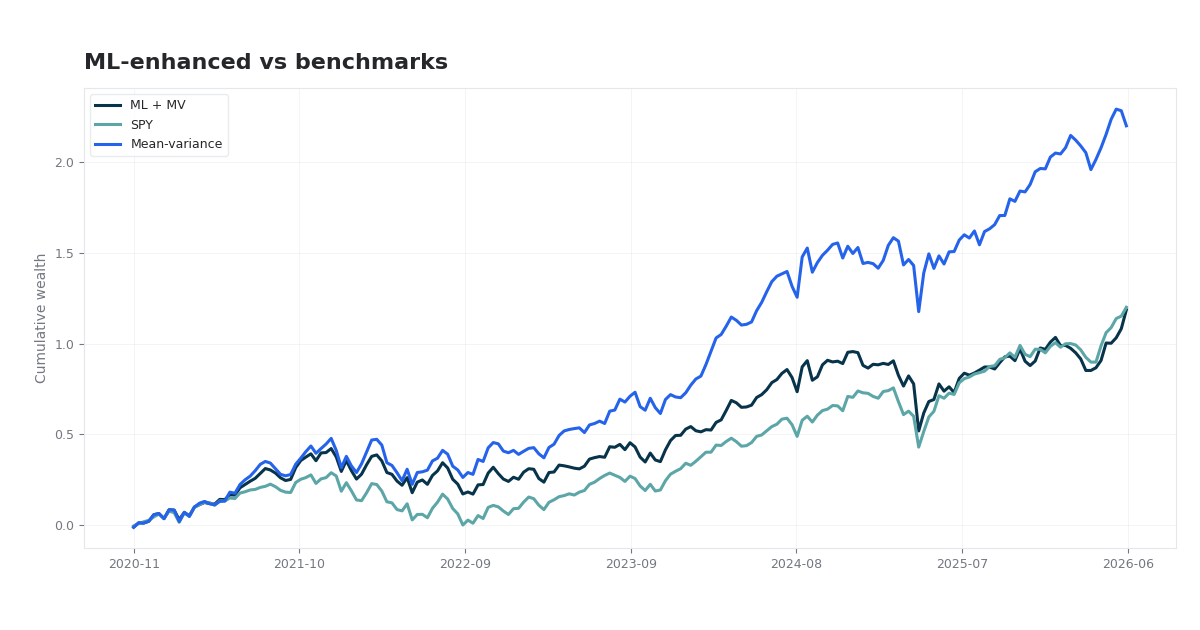 US ML-Enhanced Portfolio Optimization US (2026) ML-enhanced portfolio optimization on a 30-stock US panel: quarterly walk-forward backtests using mean-variance (MVO) with XGBoost return forecasts blended via Black-Litterman, evaluated against SPY with return, risk, and SPY-relative analytics (drawdowns, beta/alpha, VaR/CVaR, tracking error/capture, sector concentration, and ranked signals). MVO · XGBoost · Black-Litterman · SPY-relative risk · VaR/CVaR · Sector allocation |
| 15. |  Optimal Portfolio Rebalancing via Dynamic Programming US (2026) Sun et al. (MIT) optimal rebalancing on S&P 500 GICS sector sleeves — certainty-equivalent tracking error, Bellman partial rebalancing, and Monte Carlo comparison versus calendar and tolerance-band policies. Bellman DP · certainty equivalent · partial λ-rebalance · sector ETFs · Tables IV & VI |
| 16. |  Momentum Rebalance Frequency Study US (2026) 12-1 momentum on US large caps across semi-annual, quarterly, monthly, and weekly rebalance cadences — turnover, net Sharpe, and implementation efficiency. 12-1 momentum · semi-annual · quarterly · monthly · weekly · turnover · cost scenarios |
| 17. | 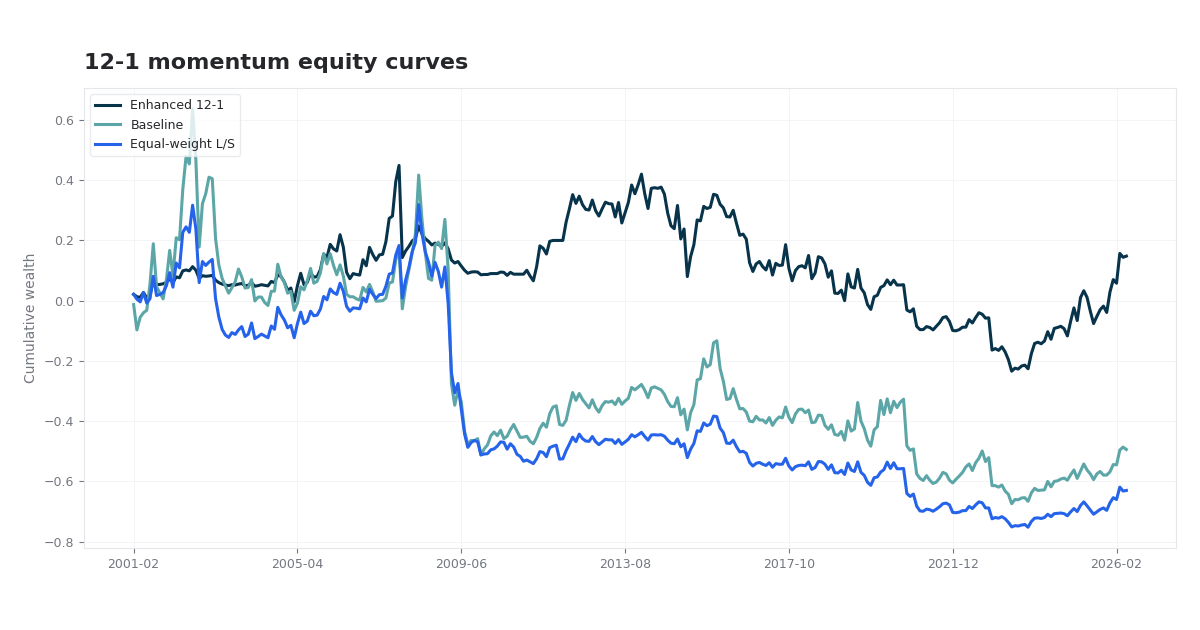 Cross-Sectional 12-1 Momentum in S&P 500 US (2026) Jegadeesh-Titman 12-1 momentum on US large caps: alpha persistence, regime dependence, crash risk, vol-managed overlays, factor decomposition, and ML crash prediction. yfinance · decile sorts · CAPM/FF/Carhart · regime · ML crashes |
| 18. | 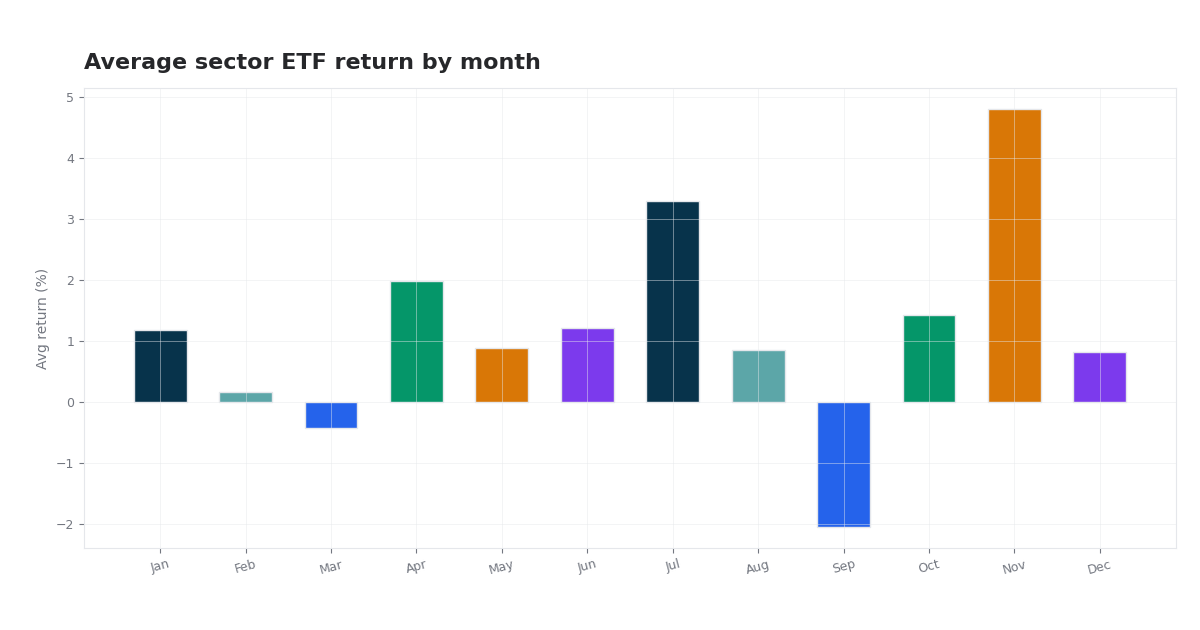 Calendar Effects in US GICS Sector ETFs US (2026) Empirical seasonality framework for eleven SPDR GICS sector ETFs vs SPY: calendar-month averages, cyclical vs defensive dispersion, benchmark-relative rotation, and exploratory inference. yfinance · SPDR sector ETFs · calendar seasonality · t-tests |
| 19. | 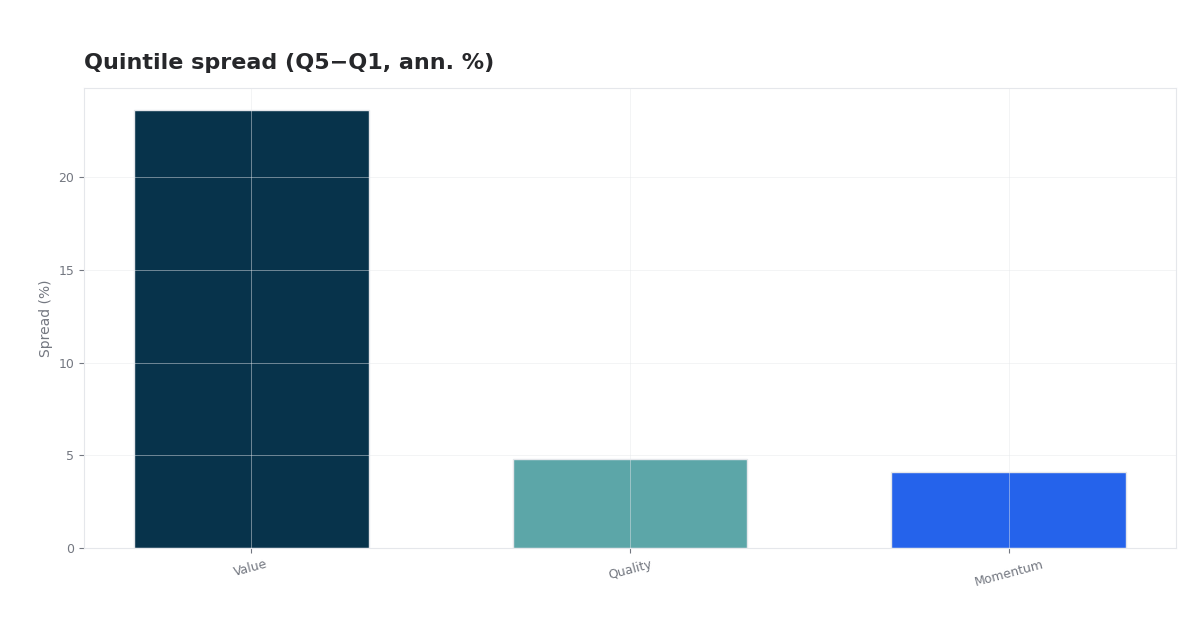 US Multi-Factor Risk & Return Model US (2026) Value, Quality, and Momentum on a US large-cap panel with nonlinear spec tests, IC/quintile diagnostics, and return attribution. Panel OLS, model selection, IC, quintiles, attribution |
| 20. | 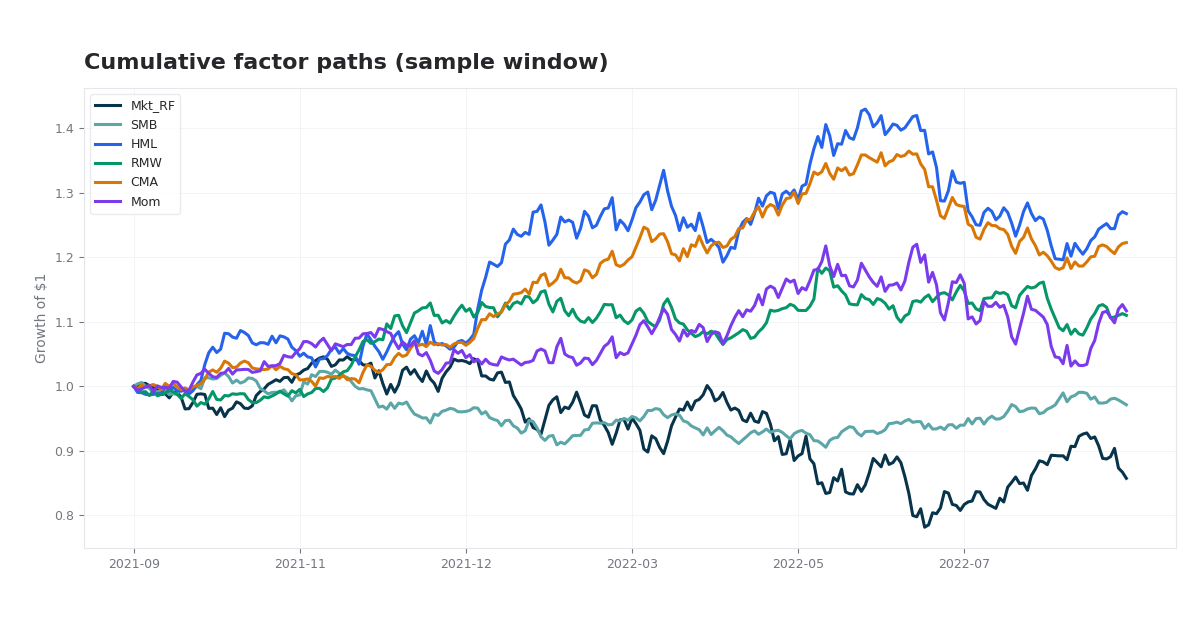 Fama–French Factor Lab US (2026) Unified factor dashboard: US FF5 and Carhart momentum, multi-asset ETF panel, international sleeve comparison, volatility regimes, risk budgeting, sleeve attribution, SPY research grid, and q-factor extension notes. Refreshed from Ken French + yfinance. Python, pandas, linear factor models, Ken French data, yfinance |
| 21. | 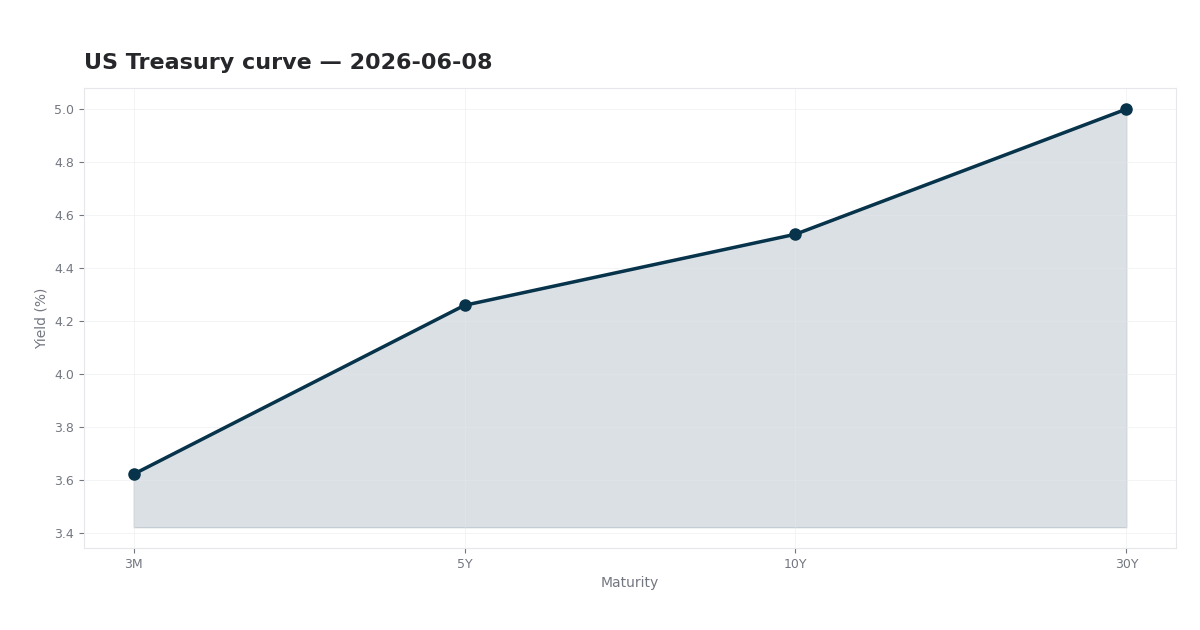 Yield Curve Intelligence US (2026) Yield-curve research project built from yfinance market data: Nelson-Siegel fitting, slope/inversion diagnostics, and regime-aware risk context. Python, yfinance, Nelson-Siegel, macro risk signals |
| 22. |  Stock Sentiment Tracker US (2025) US equity sentiment tracker using VADER lexical analysis on financial news headlines. Tracks prices, sentiment scores, and correlations for S&P 500 stocks. Updated daily. Python, VADER, NLP, financial news APIs |
| 23. | 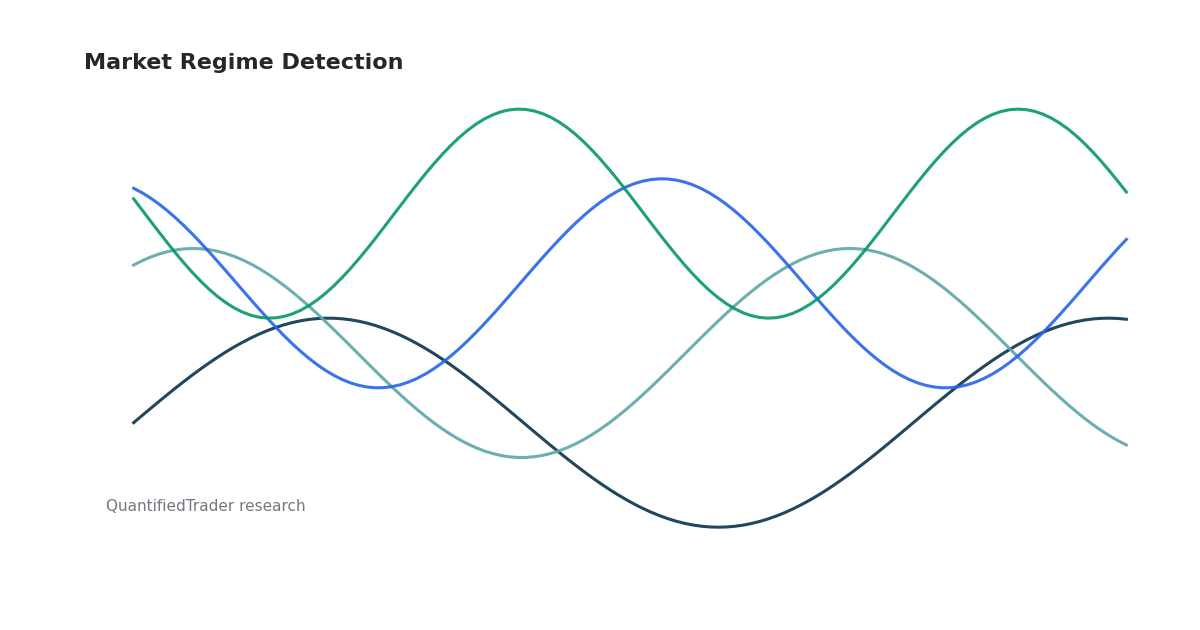 Market Regime Detection Using Gaussian Models US (2025) Comprehensive market regime identification across 21 global indices using Gaussian Mixture Models (GMM) and Greedy Gaussian Segmentation (GSS). Detects bull, bear, and transition regimes for adaptive portfolio management. Python, GMM, GSS, regime detection |
| 24. |  Fundamental Stock Analysis US (2026) US large-cap fundamental analytics dashboard with deep cross-sectional ranking, distribution diagnostics, sector structure, risk/return mapping, and multi-factor composite interpretation. Python, fundamental screening, interactive charts |
| 25. |  Optimal Execution with RL Agent (DQN) US (2026) Deep Q-Learning execution agent for slicing large orders under microstructure-style market impact. Compared against TWAP, passive, aggressive, and random baselines. Python, Gymnasium, Stable-Baselines3, execution simulation |
| 26. |  Statistical Analysis of Trading Strategies US (2026) Research guide to rigorous backtesting, overfitting detection, and data-snooping correction — White's RC, Hansen SPA, PBO, CPCV, DSR, and Monte Carlo validation. Research, statistical validation, backtesting methodology |
| 27. |  Adaptive Portfolio Strategies: Sequential Allocation Methods US (2025) Comprehensive analysis of 14 sequential portfolio allocation strategies on diversified ETF portfolio. Includes momentum-based, reversion-based, and pattern-learning approaches with transaction cost analysis. Python, sequential optimization, backtesting |
| 28. |  Relative Rotation Graph (RRG) — US Equity US (2025) Dynamic RRG for US stocks vs S&P 500. JdK RS-Ratio and RS-Momentum with animation. Python, yfinance, Recharts |
| 29. |  Diversified Stock Portfolio Using Clustering Analysis US (2024) S&P 500 portfolio construction using K-means clustering on risk/return features (correlation, beta, returns, volatility, Sharpe ratio). Backtested vs index. Python, K-means, backtesting |
| 30. |  Risk Reports & Stop / Take-Profit Analysis US (2026) Interactive risk–return maps for 71 equity index strategies and 54 options ETF backtests, plus a stop-loss / take-profit sensitivity lab on ^GSPC. Recharts, backtest aggregation, SL/TP experiment |
| 31. |  Hierarchical PCA and Modeling Asset Correlations US (2026) Dynamic clustering with Hierarchical PCA for sector-based equity portfolio management: statistical sign-pattern clusters and K-means on PCA loadings, following Avellaneda and Serur (2020). HPCA · statistical clustering · K-means · Avellaneda & Serur (2020) |