Cryptocurrencies have revolutionized the financial landscape, presenting both opportunities and challenges for traders. Seasonality, a recurring pattern in asset prices, holds the key to unlocking potential market trends. By analyzing historical price patterns at specific times of the year, traders can make informed decisions to maximize profits in Cryptocurrency Trading
Table of Contents
This article explores the concept of seasonality in cryptocurrency trading, with a primary focus on Bitcoin and other crypto assets. Students will be guided through a step-by-step process to build a powerful predictive model using Python. Additionally, we will delve into equations, theorems, and insights from diverse sources to understand and utilize seasonality effectively in financial markets.
For downloading many more Strategies Juypter Notebook, you can follow my Github repository Econometrics_for_Quants
Understanding Seasonality in Cryptocurrency Trading
- Decoding Seasonality in Financial Markets:
Seasonality denotes repetitive patterns or cycles in asset prices that occur at particular times of the year. These patterns can stem from a myriad of factors, such as investor behavior, market sentiment, and economic events.
- Understanding Seasonality in the Crypto Market:
Cryptocurrency markets, including Bitcoin, have exhibited compelling seasonal patterns. For example, the year-end often witnesses a bullish trend due to increased interest and institutional investment before the holiday season.
- Use of Power of Seasonal Research:
Prominent research works in financial seasonality shed light on intriguing phenomena like the January Effect, where assets tend to outperform in January, and the Halloween Effect, highlighting the strong performance of stocks between November and April.
Building a Seasonal Analysis Model using Python for Cryptocurrency Trading:
Step 1: Gather Historical Cryptocurrency Data
Initiate the process by employing Python’s yfinance library to collect historical price data for Bitcoin and desired crypto assets. This data will serve as the foundation for the seasonal analysis.
Step 2: Preprocess and Cleanse the Data
Clean and preprocess the data, addressing missing values and ensuring proper date formatting. Data preparation is vital for precise analysis.
Step 3: Incorporate Date Information
Enhance the dataset by extracting day names, month names, and years from the date index. This enables the exploration of seasonality at different granularities.
Step 4: Normalize Trading Volume
Compute the volume moving average to normalize the trading volume, preventing it from overshadowing seasonal patterns.
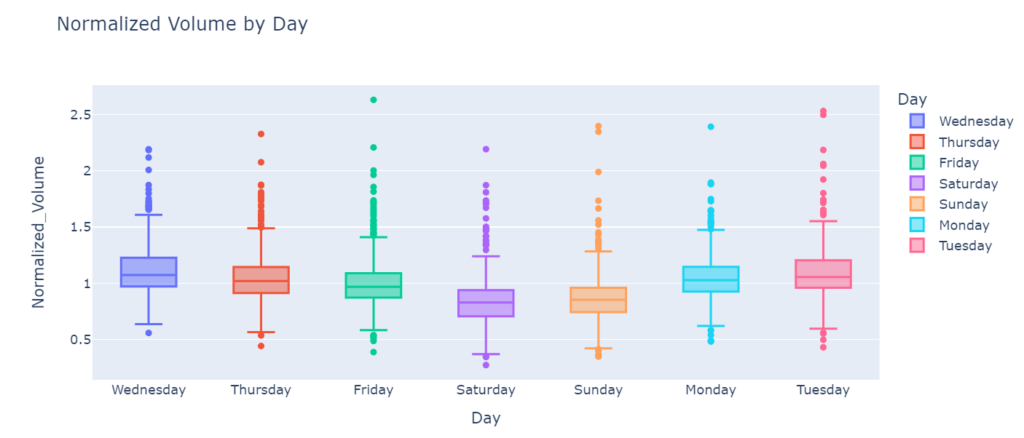
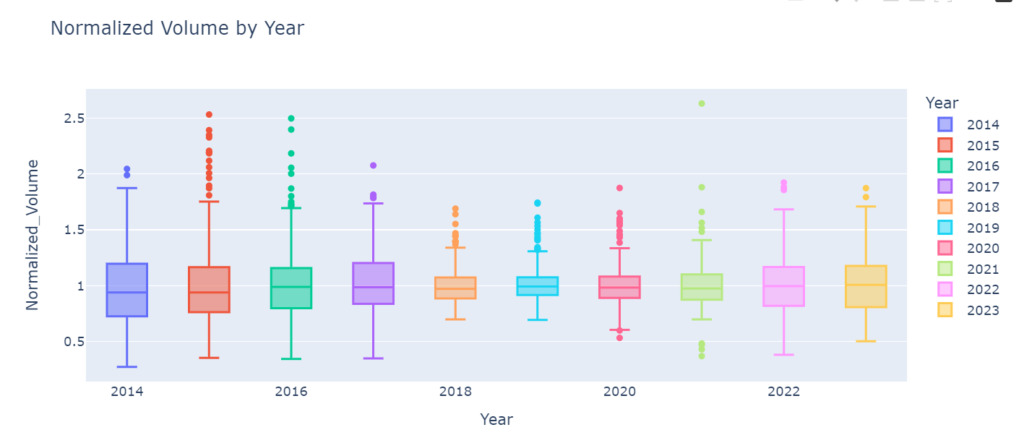
Step 5: Create Informative Box Plots
Generate box plots to visualize the normalized volume against day names, month names, and years. These visualizations facilitate the identification of potential seasonal trends.
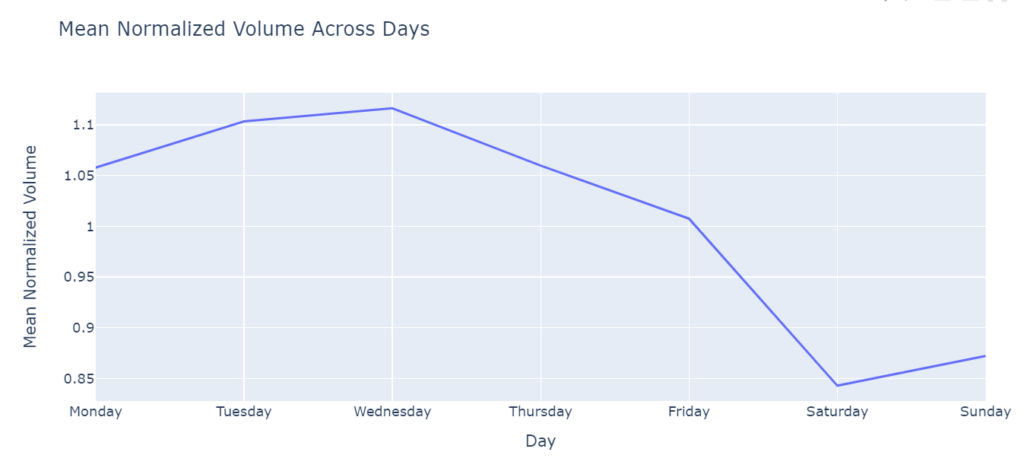
Step 6: Analyze Mean Normalized Values
Calculate the mean normalized values of volume for each day, month, and year. Utilize line plots to visualize the average seasonal patterns.
For more information on Indian Markets, follow us on our blog Dhanpedia
Exploring Advanced Insights on Seasonality in Cryptocurrency Trading
Apart from daily, monthly, and yearly patterns, traders can delve into intraday seasonality, which reflects price behavior within specific hours of the day.
Seasonal patterns can be influenced by major news events, regulatory changes, and market sentiment, leading to short-term deviations.
Combining seasonal analysis with traditional technical analysis methods can enhance the overall trading strategy.
Equations and Observations Related to Seasonality
Autoregressive Integrated Moving Average (ARIMA) Model
ARIMA is a popular time series forecasting model that incorporates autoregression, differencing, and moving averages to capture seasonal patterns.
ARIMA(p, d, q) model: Y(t) = c + Σ(φ_i * Y(t-i)) + Σ(θ_i * ε(t-i)) + ε(t)where, Y(t) – The value at time t c – Constant term φ_i – Autoregressive coefficients θ_i – Moving average coefficients ε(t) – Error term at time t
Seasonal Autoregressive Integrated Moving Average (SARIMA) Model
A variation of the ARIMA model, the SARIMA model considers seasonal components in addition to autoregressive and moving average terms. It is effective for capturing complex seasonality in time series data.SARIMA(p, d, q)(P, D, Q, S) model: Y(t) = c + Σ(φ_i * Y(t-i)) + Σ(θ_i * ε(t-i)) + Σ(Φ_i * Y(t-iS)) + Σ(Θ_i * ε(t-iS)) + ε(t)where, Y(t) – The value at time t c – Constant term φ_i – Autoregressive coefficients θ_i – Moving average coefficients Φ_i – Seasonal autoregressive coefficients Θ_i – Seasonal moving average coefficients ε(t) – Error term at time t S – Seasonal period
Fisher Hypothesis:
The Fisher Effect suggests that nominal interest rates consist of real interest rates and expected inflation rates. Investors can apply this theorem to identify seasonality in interest rates and adjust their trading strategies accordingly.
January Barometer
The January Barometer states that the performance of the stock market in January can predict its performance for the entire year. Traders can adapt this theorem to cryptocurrencies and assess January’s impact on yearly trends.
You can find Free Trading Strategies and much more content on my blog quantifiedtrader.com
Exploring Seasonality in Cryptocurrency Trading:
- Leveraging Cyclical Patterns: Seasonality often exhibits cyclical trends, repeating over specific periods such as days, months, or years. Identifying these cycles can provide traders with valuable information on when to enter or exit positions.
- The Santa Claus Rally: A famous seasonal pattern in financial markets, the Santa Claus Rally refers to the tendency for stock prices to rise during the last week of December and the first two trading days of January. This phenomenon can also be observed in the cryptocurrency market.
- Seasonality in Altcoins: Seasonal patterns are not exclusive to Bitcoin; altcoins, the alternative cryptocurrencies to Bitcoin, may also display their unique seasonality. Traders should research specific altcoins to uncover their seasonal trends.
- Calendar Anomalies: Calendar anomalies, like the Monday Effect or Turn of the Month Effect, suggest that certain days of the week or month exhibit abnormal returns. Traders can factor these anomalies into their seasonal analysis.
- Fundamental vs. Seasonal Analysis: While fundamental analysis assesses an asset’s intrinsic value, seasonal analysis focuses on historical price patterns. Combining both approaches can enhance traders’ understanding of asset performance.
Advanced Strategies for Seasonal Cryptocurrency Trading:
- Pairing Seasonality with Sentiment Analysis: Combining seasonality with sentiment analysis helps traders understand how market sentiment influences seasonal trends, leading to more informed decisions.
- Using Options for Seasonal Strategies: Options strategies, such as calendar spreads, can capitalize on anticipated seasonal trends. Traders can use options to hedge against market fluctuations during seasonal periods.
- Seasonality in Short-Term Trading: Seasonal patterns can be valuable in short-term trading, helping traders identify short-lived opportunities within larger seasonal trends.
- Applying Machine Learning for Seasonal Forecasting: Machine learning algorithms, like decision trees and random forests, can be applied to forecast seasonal patterns in complex cryptocurrency datasets.
FAQs on Seasonality in Cryptocurrency Trading:
Q1. Can seasonality be applied to other financial instruments besides cryptocurrencies? Yes, seasonality is relevant to various financial instruments, including stocks, commodities, and forex. Traders can explore seasonality in multiple markets to make well-informed decisions.
Q2. Are there specific months or days with pronounced seasonality in cryptocurrency trading? Yes, certain months, such as December and January, often exhibit stronger seasonality due to year-end factors and the beginning of the new year.
Q3. How reliable is seasonality in predicting cryptocurrency market trends? While seasonality provides valuable insights, it should not be the sole basis for trading decisions. Combining seasonality with other analytical tools ensures a more robust trading strategy.
Q4. How do I determine the appropriate seasonal period (S) for the SARIMA model? The choice of the seasonal period depends on the data and the observed patterns. For daily data, S=7 for weekly seasonality, while S=30 for monthly seasonality. Experiment with different values to find the best fit for your dataset.
Q5. Can I use seasonality to predict long-term price trends in cryptocurrencies? While seasonality provides insights into recurring patterns, it may not be sufficient to predict long-term trends. Consider combining seasonality with other indicators and conducting thorough research before making long-term predictions.
Q6. How can I incorporate seasonality into my risk management strategy? Seasonality can help in optimizing entry and exit points, which indirectly impacts risk management. By understanding when seasonal trends are likely to occur, traders can adjust their positions accordingly and implement risk management measures more effectively.
Conclusion
Seasonality is a potent tool for understanding cryptocurrency market trends, particularly with assets like Bitcoin. By harnessing historical patterns and building predictive models using Python, traders gain a competitive edge in the dynamic world of crypto trading. Equations and theorems deepen our understanding of seasonality, while advanced insights help refine trading strategies.
Remember, seasonality serves as a complementary analytical technique and should be coupled with other methodologies for a comprehensive trading approach. Embracing seasonality empowers traders to navigate the ever-evolving cryptocurrency landscape with greater confidence and foresight.
Share via:

