Posted inTrading Trading Strategy Evaluating Trading Strategy: A Comprehensive Guide to Performance Comparison Posted by By Paras Parkash 7 October 2023 In the world of financial markets, the ability to assess and compare the performance of…
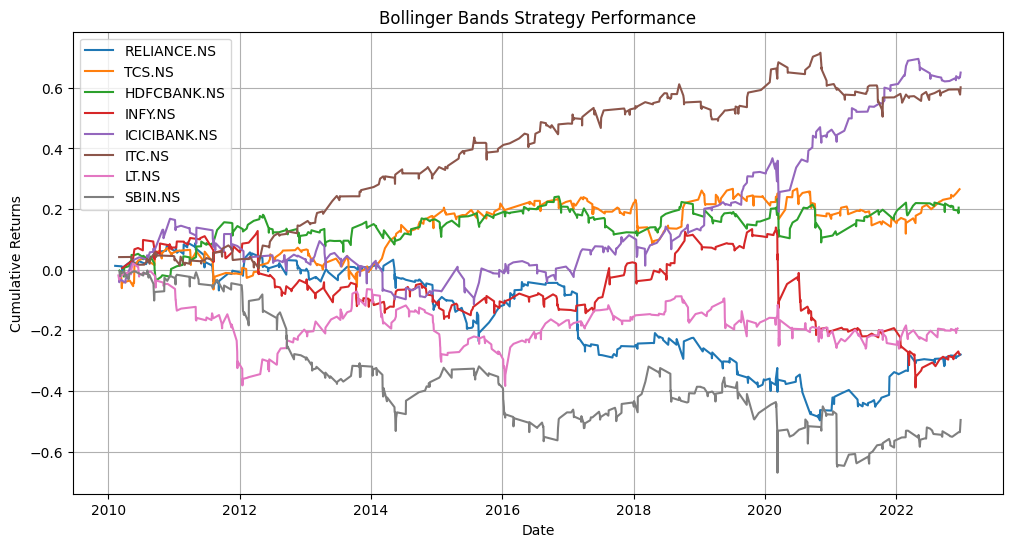
Posted inAlgorithmic Trading Trading Strategy Understanding Bollinger Bands and Their Significance in Assessing Stock Market Performance Posted by By Paras Parkash 3 October 2023 Bollinger Bands are a popular technical indicator used by traders and investors to analyze stock…
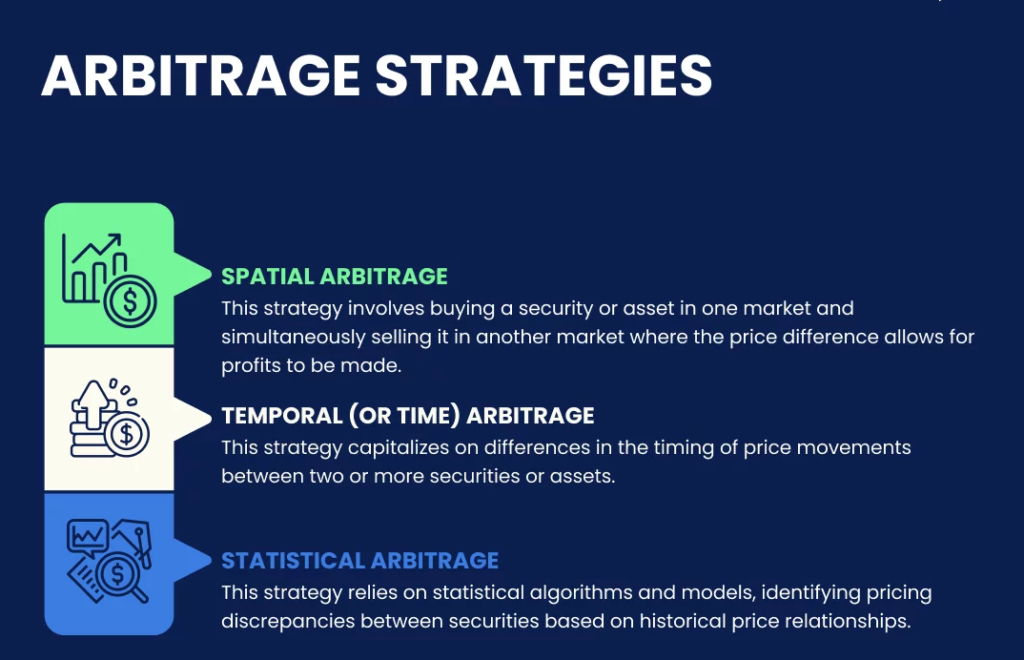
Posted inTrading High Frequency Trading Understanding Stat Arb in High-Frequency Trading Posted by By Paras Parkash 19 September 2023 High-frequency arbitrage or Stat Arb in the realm of High-Frequency Trading (HFT) has revolutionized the…
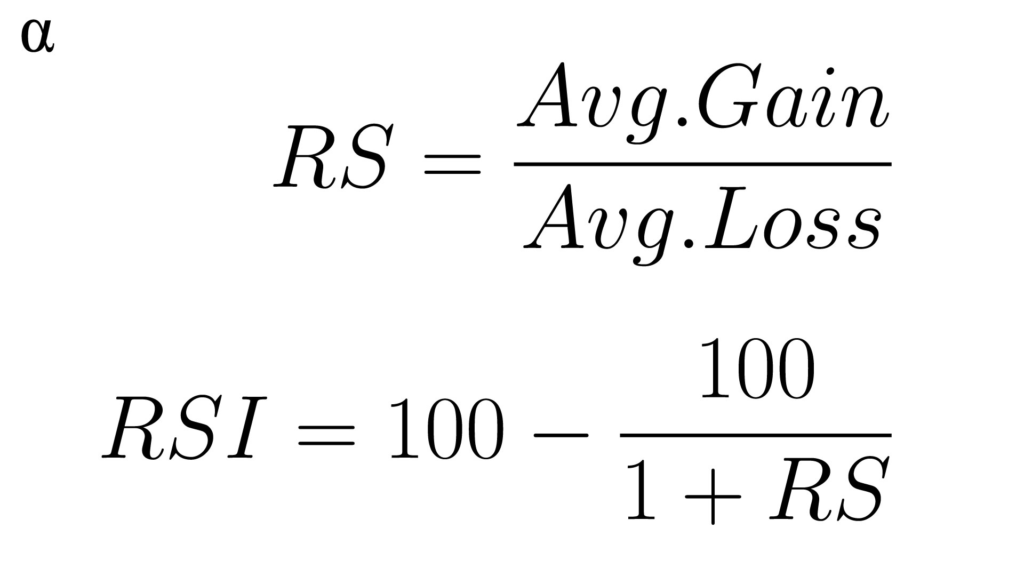
Posted inTrading Algorithmic Trading How to Backtest RSI Strategy for Trading using Python Posted by By Paras Parkash 11 September 2023 Algorithmic trading has revolutionized the financial markets, empowering traders to execute strategies with precision and…
Posted inHigh Frequency Trading Algorithmic Trading How to increase performance by 100x using FPGA (Field Programmable Gate Array) Posted by By Paras Parkash 1 September 2023 In the fast-paced world of high-frequency trading (HFT), microseconds can mean the difference between profit…
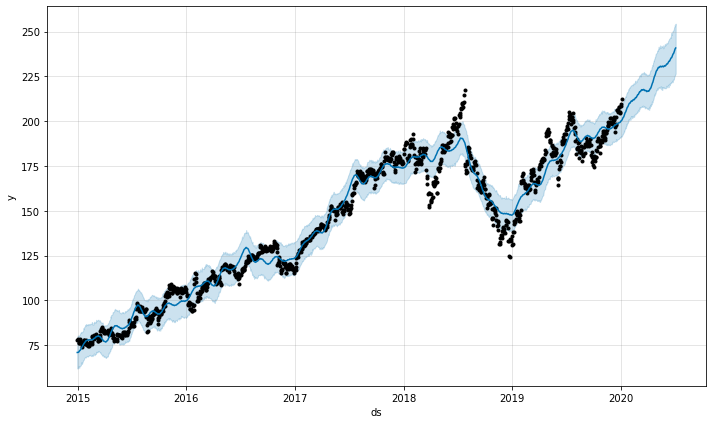
Posted inEconometrics Financial Data Analysis Trading Strategy How to quickly Build a Stock Market Prediction App Using FB Prophet Posted by By Paras Parkash 25 July 2023 In this article, we will walk through the functioning of a stock prediction app that…
Posted inTechnical Analysis Learn How to Filter Market Noise with Fourier Transform Posted by By Paras Parkash 21 July 2023 In the dynamic realm of financial markets, distinguishing true market trends from random noise in…
Posted inAlgorithmic Trading How to Use Candlesticks Patterns for Trading Posted by By Paras Parkash 15 July 2023 Candlestick analysis is a popular method used by traders to interpret stock price movements. By…
Posted inAlgorithmic Trading Comprehensive Guide to Trading with Trend Analysis with Python Posted by By Paras Parkash 14 July 2023 Comprehensive Guide to Trading with Trend Analysis with Python
Posted inTechnical Analysis Algorithmic Trading How to make a 15x Profit using the Rainbow Moving Average Indicator in Forex Posted by By Paras Parkash 20 May 2023 Rainbow Moving Averages (MA) is a unique technical indicator that displays multiple moving averages simultaneously…