In the fast-paced world of financial markets, the order book plays a crucial role in providing traders with valuable information about the supply and demand dynamics for a specific security. It is a dynamic list of buy and sell orders, offering insights into the market depth and helping traders make informed decisions. In this article, we will delve into the concept of the order book and explain 30 essential terms related to it.
For downloading many more Strategies Juypter Notebook, you can follow my Github repository Econometrics_for_Quants
The Anatomy of an Order Book
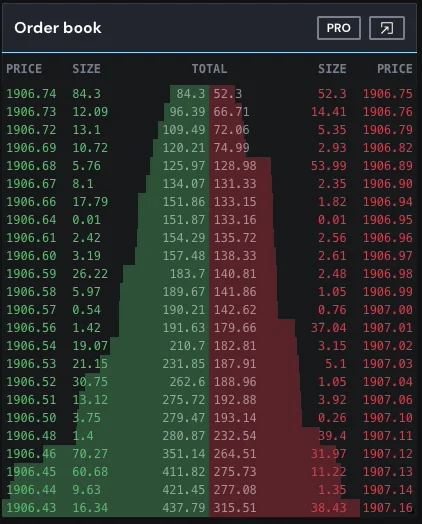
An order book is a real-time record of buy and sell orders for a particular financial asset, such as a stock, cryptocurrency, or commodity, in a trading platform. It shows the current market depth by displaying the prices and quantities of buy and sell orders at different levels. The order book allows traders to see the demand and supply dynamics for the asset and provides essential information for making trading decisions. Buy orders are typically listed in green, while sell orders are listed in red, making it easy to distinguish between them. The order book is constantly updated as new orders are placed or existing ones are fulfilled, reflecting the ever-changing market conditions.
-
- Bid Price – The highest price at which traders are willing to buy a security.
-
- Bid Quantity – The number of shares or contracts traders are willing to purchase at the bid price.
-
- Ask (or Offer) Price – The lowest price at which traders are willing to sell a security.
-
- Ask Quantity – The number of shares or contracts traders are willing to sell at the asking price.
-
- Spread – The difference between the bid and ask prices, indicates the cost of trading the security.
-
- Market Depth – A measure of the number of buy and sell orders in the order book. High market depth suggests a liquid market with significant trading activity.
-
- Market Order – An order to buy or sell a security at the best available price in the order book.
-
- Limit Order – An order to buy or sell a security at a specific price or better. It will only execute when the market reaches the specified price.
-
- Stop Order – An order that becomes a market order when the security’s price reaches a specified level (stop price). It is designed to limit losses or protect profits.
-
- Fill or Kill (FOK) – An order type requiring immediate and complete execution of the entire order quantity or none at all.
-
- Immediate or Cancel (IOC) – An order type that executes any portion of the order immediately and cancels the rest.
-
- Time in Force (TIF) – An instruction specifying how long an order should remain active. Common TIF options include day orders, good-till-canceled (GTC), and fill or kill.
-
- Level 2 Quotes – A display of the order book’s depth, showing the best bid and ask prices, as well as other price levels and corresponding quantities.
-
- Order Flow – The real-time flow of buy and sell orders in the market, reflecting the interests of traders.
-
- Hidden Orders – Orders that are not displayed in the order book, providing traders with anonymity.
-
- Order Routing – The process of sending orders to different exchanges or trading venues to find the best execution price.
-
- Smart Order Routing (SOR)– An automated process that intelligently routes orders to different venues to optimize execution.
-
- Sweep Order – An order that searches multiple market venues for the best available price.
-
- Iceberg Order – A large order that is divided into smaller, visible portions to prevent revealing the entire order size.
-
- Price Improvement – An execution at a better price than the one requested by the trader, providing cost savings.
-
- Pegged Order – An order type that dynamically adjusts its price based on a reference point in the order book.
2. Market Depth Insights
Market depth is a measure of the number of buy and sell orders in the order book. High market depth suggests a liquid market with significant trading activity, indicating a more robust market where orders can be executed smoothly without significantly impacting the security price.
High-Frequency Trading (HFT) strategies heavily rely on market depth data to make split-second trading decisions. Here are some examples of how market depth is utilized in HFT strategies:
-
- Liquidity Detection: HFT algorithms use market depth to identify areas with high liquidity, allowing them to execute large orders without causing significant price impact.
-
- Order Book Imbalance: HFT traders monitor the market depth to detect imbalances in buy and sell orders, anticipating short-term price movements.
-
- Spread Trading: HFT strategies analyze the bid-ask spread in the order book to identify opportunities for quick profits from small price discrepancies.
-
- Order Execution Timing: HFT algorithms assess the order book to optimize the timing of order execution, aiming for the most favorable prices.
-
- Stop-Loss Triggering: Market depth data helps trigger stop-loss orders based on predefined price levels, protecting HFT traders from excessive losses.
-
- Market Making: HFT firms act as market makers, placing both buy and sell orders in the order book to provide liquidity and profit from bid-ask spreads.
-
- Order Flow Analysis: HFT traders analyze the inflow and outflow of orders in the order book to gauge the overall market sentiment.
-
- Momentum Trading: Market depth data is used to identify surges in order volume, indicating potential momentum in a particular direction.
-
- Scalping: HFT strategies exploit small price movements by entering and exiting positions rapidly, relying on real-time market depth for quick decision-making.
-
- Arbitrage: HFT firms use market depth to identify arbitrage opportunities between different exchanges or trading venues, where prices for the same asset might vary.
In HFT, the ability to process and act on market-depth data in milliseconds or microseconds is crucial to gain a competitive edge and maximize profits. These strategies showcase how the utilization of market depth information is central to the success of HFT firms.
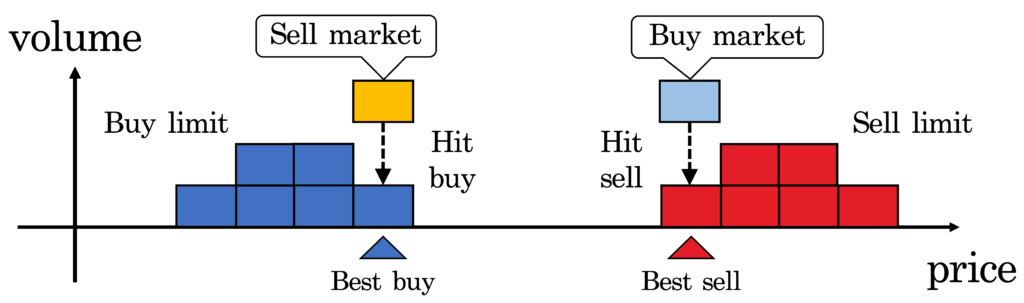
Order Matching Process
When a new order is placed, the exchange’s order matching engine matches it with existing opposite orders. The matching is done based on the “Price-Time Priority” rule, where orders at the same price level are executed based on the time they were placed. This process ensures fair execution for all traders.
Here’s a detailed explanation of the process:
-
- Order Submission: The process begins when a trader submits a new buy or sell order through their trading platform or directly to the exchange’s system. The order includes important information such as the type of order (market order or limit order), the quantity of the asset to buy or sell, and the price at which the trader is willing to buy or sell the asset.
-
- Order Book: Once the order is submitted, it enters the order book. The order book is a real-time, electronic record that displays all active buy and sell orders for a particular asset on the exchange. It is organized based on price levels, with the highest bid (buy) prices on top and the lowest ask (sell) prices at the bottom.
-
- Price-Time Priority: The order matching process follows the “Price-Time Priority” rule, which means that orders are matched based on two key factors:
-
- Price: The price at which the order is placed.
-
- Time: The timestamp indicates when the order was received by the exchange’s system.
-
- Price-Time Priority: The order matching process follows the “Price-Time Priority” rule, which means that orders are matched based on two key factors:
-
- Matching Process: The exchange’s order matching engine constantly scans the order book for potential matches. When a new order is submitted, the engine checks if there is an opposite order in the order book that matches the criteria. The matching criteria include:
-
- For a buy order, the engine looks for sell orders at the same or lower price level.
-
- For a sell order, the engine looks for buy orders at the same or higher price level.
-
- Matching Process: The exchange’s order matching engine constantly scans the order book for potential matches. When a new order is submitted, the engine checks if there is an opposite order in the order book that matches the criteria. The matching criteria include:
-
- Quantity Matching: If the matching engine finds an opposite order that satisfies the price and time criteria, it then checks the quantities of both orders. For a complete trade to occur, the quantity of the new order must match or exceed the quantity of the opposite order.
-
- Execution: If the price, time, and quantity criteria are met, the matching engine executes the trade. The asset is transferred from the seller’s account to the buyer’s account, and the corresponding funds (or other assets used for payment) are transferred from the buyer’s account to the seller’s account.
-
- Partial Execution: If the quantity of the new order is larger than the opposite order, a partial execution occurs. The matching engine executes the portion of the new order that matches the opposite order’s quantity, and the remaining quantity stays in the order book as an active order until it finds a new match or is canceled.
-
- Continuous Process: The order-matching process is continuous and dynamic. New orders can be placed, matched, and executed in real-time, reflecting the ever-changing supply and demand in the market.
-
- Time Priority: If multiple orders are at the same price level and match the incoming order, the time at which the orders were submitted becomes crucial. The order that arrived first will be executed before the others, adhering to the time priority principle.
This order-matching process ensures fair and efficient trade execution on the exchange, as all traders have an equal opportunity to participate in the market based on their chosen prices and the timing of their orders.
You can find Free Trading Strategies and much more content on my blog quantifiedtrader.com
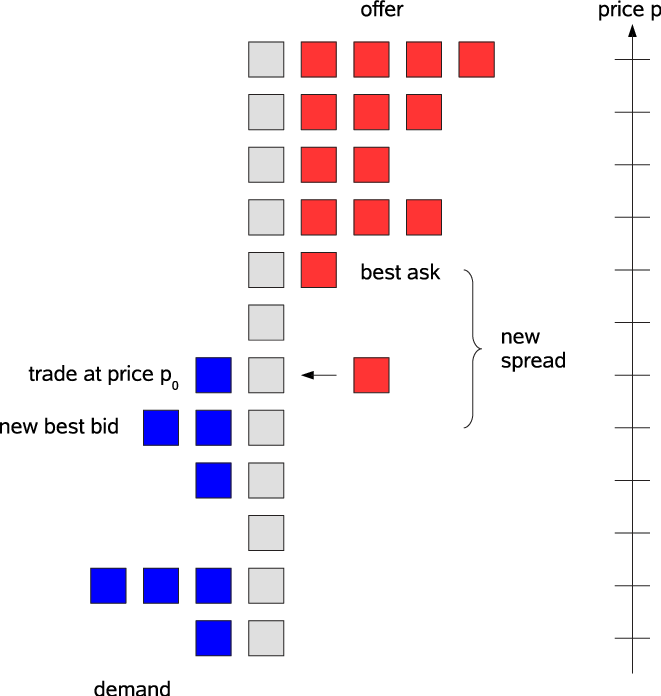
Understanding Bid-Ask Spread Analysis
Bid-Ask Spread Analysis is a fundamental concept used by traders to assess the cost and liquidity of trading security (such as a stock, cryptocurrency, or commodity) in the financial markets. It involves studying the difference between the highest price that buyers are willing to pay (the bid) and the lowest price at which sellers are willing to sell (the ask) at any given moment.

Here’s a detailed explanation of Bid-Ask Spread Analysis:
-
- Definition of Bid and Ask Prices: In the financial markets, a bid price represents the maximum price a buyer is willing to pay for a security, while the ask price represents the minimum price a seller is willing to accept for the same security. The difference between these two prices is known as the bid-ask spread.
-
- Bid-Ask Spread Calculation: The bid-ask spread is calculated by subtracting the ask price from the bid price. Mathematically, Bid-Ask Spread = Bid Price – Ask Price.
-
- Interpretation of Narrow Spread: When the bid-ask spread is narrow, it means that the difference between the highest price a buyer is willing to pay and the lowest price a seller is willing to accept is relatively small. A narrow spread suggests a liquid market with high trading activity and usually indicates that there are many buyers and sellers actively participating in the market. In such a scenario, it is generally easier to buy or sell the security at a price close to the current market price.
-
- Interpretation of Wide Spread: Conversely, a wide bid-ask spread indicates a larger difference between the highest bid price and the lowest ask price. A widespread typically suggests lower liquidity in the market, meaning that there are fewer buyers and sellers actively trading the security. This can result in potential price volatility and difficulty in executing trades at the desired price, especially for larger order sizes.
-
- Impact of Spread on Trading Costs: The bid-ask spread directly affects the cost of trading security. When traders buy security, they usually pay the ask price, and when they sell, they receive the bid price. This difference between the two prices represents a transaction cost that traders need to consider.
-
- Market Conditions and Spread: The bid-ask spread is not fixed and can vary based on market conditions, trading volume, and overall market sentiment. During times of high market uncertainty or low trading volume, spreads tend to widen, making it more expensive for traders to execute trades.
-
- Understanding Market Depth: Bid-Ask Spread Analysis is closely related to market depth, which is the cumulative volume of buy and sell orders at different price levels in the order book. Traders use market depth to assess the potential price movement and liquidity of a security.
-
- Spread and Market Efficiency: In highly efficient and liquid markets, bid-ask spreads are typically narrower, as there is a higher level of competition among market participants. In less efficient or thinly traded markets, spreads tend to be wide
Understaning Order Book Imbalance
Order Book Imbalance is a key concept in financial markets, particularly for traders seeking to gain insights into the supply and demand dynamics of security. It refers to the disparity between the total buy (bid) orders and the total sell (ask) orders at different price levels in the order book. Here’s a detailed explanation of Order Book Imbalance and its significance for traders:
-
- Order Book Overview: The order book is a real-time, electronic record that displays all active buy and sell orders for a particular security on a financial exchange. It is organized based on price levels, with the highest bid (buy) prices on top and the lowest ask (sell) prices at the bottom.
-
- Buy Orders (Bids): Buy orders represent the prices at which traders are willing to buy the security. These orders are listed in descending order, with the highest bid price at the top.
-
- Sell Orders (Asks): Sell orders represent the prices at which traders are willing to sell the security. These orders are listed in ascending order, with the lowest ask price at the bottom.
-
- Order Book Imbalance Calculation: Order Book Imbalance is calculated by comparing the total volume (quantity) of buy orders to the total volume of sell orders at a specific price level. It can be expressed as the difference between the two sides or as a percentage. Mathematically, Order Book Imbalance = (Total Buy Volume – Total Sell Volume).
-
- Interpreting Order Book Imbalance: A positive Order Book Imbalance indicates that there is more buy volume at a particular price level than sell volume. Conversely, a negative Order Book Imbalance means that there is more sell volume than buy volume at that price level.
-
- Significance for Traders: Order Book Imbalance is a critical tool for traders, as it provides valuable insights into the current market sentiment. When there is an imbalance between buy and sell orders, it suggests a potential shift in market dynamics.
-
- Market Sentiment Analysis: A positive Order Book Imbalance, with more buy orders than sell orders, may indicate bullish market sentiment. Traders interpret this as an expectation of higher prices in the near term.
-
- Anticipating Price Movements: Traders use Order Book Imbalance to anticipate potential price movements. For example, a significant positive imbalance may lead traders to expect upward price momentum, while a significant negative imbalance may suggest potential downward price pressure.
-
- Confirmation Tool: Order Book Imbalance analysis is often used in conjunction with other technical and fundamental indicators to confirm or validate trading signals.
-
- Intraday Trading: Intraday traders, especially those using scalping or momentum strategies, frequently monitor Order Book Imbalance to identify short-term trading opportunities based on rapid changes in market sentiment.
-
- Volatility Indicator: Order Book Imbalance can also serve as a volatility indicator. A highly imbalanced order book may suggest potential price swings, while a balanced order book may indicate a calmer market environment.
-
- Dynamic Nature: Order Book Imbalance is dynamic and can change rapidly as new orders are placed or existing ones are canceled or executed. Traders need to monitor it in real-time to stay up-to-date with market conditions.
-
- Limitations: While Order Book Imbalance provides valuable insights, it is essential to combine it with other market indicators and analysis methods to make well-informed trading decisions.
-
- Algorithmic Trading: Order Book Imbalance analysis is widely used in algorithmic trading strategies to automate trading decisions based on predefined criteria related to market sentiment and order book dynamics.
In conclusion, Order Book Imbalance is a powerful tool for traders to understand market sentiment, anticipate potential price movements, and identify trading opportunities. By monitoring the order book dynamics, traders can gain a competitive edge and make more informed trading decisions.
Understanding Order Flow Analysis
Order Flow Analysis is a trading methodology that involves studying the real-time flow of buy and sell orders in the financial markets. It aims to gain insights into the actions of market participants, such as individual traders, large institutional investors, and market makers, to understand the underlying market sentiment and potential price movements.
Here’s a detailed explanation of Order Flow Analysis and its significance in trading:
-
- Order Flow Overview: In financial markets, order flow represents the continuous stream of buy and sell orders being submitted by traders. Each order contributes to the demand (buy orders) or supply (sell orders) of a particular security.
-
- Real-Time Data: Order flow analysis relies on real-time data provided by exchanges, which displays the individual orders, their sizes, and the prices at which they are placed.
-
- Intentions of Traders: By analyzing order flow, traders attempt to deduce the intentions of different market participants. For instance, they may try to identify whether institutional investors are accumulating or distributing security, or if there is a significant change in market sentiment.
-
- Liquidity and Price Impact: Order flow analysis helps traders gauge the current liquidity in the market. A high volume of buy and sell orders indicates high liquidity, whereas a lack of orders can result in lower liquidity and potential price impact.
-
- Order Book Imbalance: Order flow analysis is closely related to order book imbalance, which was previously explained. Traders monitor the order book to see if there is an imbalance in buy or sell orders at different price levels, as it may suggest potential price movements.
-
- Market Participants: Large traders and institutional investors can have a substantial impact on the market. Order flow analysis attempts to identify the footprints of these market participants and understand their influence on price direction.
-
- High-Frequency Trading (HFT): Order flow analysis is commonly used by high-frequency traders who rely on real-time order flow data to make rapid trading decisions and capitalize on short-term market movements.
-
- Volume and Momentum: Sudden spikes in order flow volume can indicate increased interest and momentum in security. Traders may interpret this as a signal to enter or exit positions.
-
- Limit Order Flow: Traders also analyze the flow of limit orders, which are orders that specify a price level for execution. An increase in the number of limit orders at a specific price can reveal potential support or resistance levels.
-
- Tape Reading: Some traders practice tape reading, a form of order flow analysis where they visually analyze the time and sales data (a real-time record of individual trade transactions) to identify patterns or significant trades.
-
- News Impact: Order flow analysis can be affected by news events and market developments. News-related orders can lead to increased volatility and may offer trading opportunities.
-
- Confirmation Tool: Order flow analysis is often used as a confirmation tool in conjunction with other technical and fundamental analysis methods.
-
- Algorithmic Trading: Order flow analysis is a vital component of algorithmic trading strategies, where algorithms automatically execute trades based on predefined order flow patterns.
-
- Data Visualization: Order flow analysis is commonly visualized through various charts and indicators, such as the order book depth chart or time and sales data.
Order Flow Analysis provides traders with valuable insights into the intentions of market participants, liquidity conditions, and potential price movements. By understanding the order flow dynamics, traders can make more informed trading decisions and improve their overall trading strategies. However, it’s important to note that order flow analysis is just one of many tools available to traders, and it is typically used in conjunction with other forms of analysis to build a comprehensive trading approach.
Conclusion
An order book is a vital tool for traders to gain insights into the market depth and make well-informed trading decisions. Understanding its terminology and concepts is essential for navigating the complexities of financial markets and maximizing trading strategies. By leveraging the information provided by the order book, traders can enhance their ability to achieve successful outcomes in the dynamic world of finance.