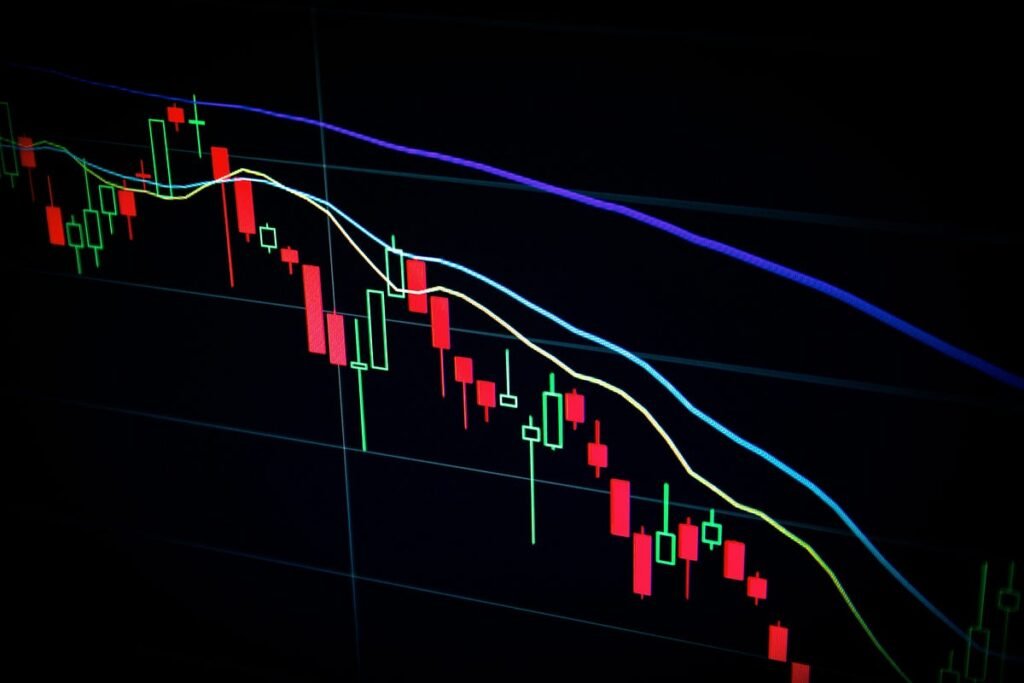
Candlestick analysis is a popular method used by traders to interpret stock price movements. By studying the patterns formed by candlestick charts, traders can gain insights into potential trend reversals, market sentiment, and entry/exit points for trades.
In this article, we will explore how to implement candlestick analysis to detect Candlesticks Patterns using Python. We will also delve into some commonly used candlestick patterns and their significance in trading decisions. So, let’s dive into the code and uncover the power of candlestick analysis.
The purpose of this article is to introduce the basics of algo trading development.
Table of Contents
We will begins by importing the necessary libraries, including pandas, numpy, yfinance, pandas_ta, and matplotlib. These libraries provide the tools required for data manipulation, technical analysis, and visualization. The code utilizes the ‘yfinance’ library to fetch historical stock data for the ticker ‘AAPL’ within a specified timeframe. This dataset will serve as the foundation for our candlestick analysis.
import pandas as pd
import numpy as np
import yfinance as yf
import pandas_ta as ta
import matplotlib.pyplot as plt

df = yf.download(tickers='AAPL',start='2018-01-01',end='2023-01-01')
print("Total number of data points are",len(df))
df.tail()

df.isna().sum()
df.reset_index(inplace=True)
# We can add multiple indicators using pandas_ta library.
df['ATR'] = df.ta.atr(length=10)
df['RSI'] = df.ta.rsi()
df.tail()
To enhance our analysis, we employ two technical indicators: Average True Range (ATR) and Relative Strength Index (RSI). ATR measures market volatility, while RSI indicates overbought or oversold conditions. These indicators offer valuable insights into potential price movements and are calculated using the ‘pandas_ta’ library. For this project, we will use only RSI. Feel Free to add more indictors and play with variables.
Candlesticks Patterns Detection
We will define functions to scan for specific candlestick patterns, such as Engulfing and Star patterns. These patterns can signal potential trend reversals or continuation. Engulfing patterns occur when one candle completely engulfs the previous candle, indicating a shift in market sentiment. Star patterns, on the other hand, consist of a small-bodied candle followed by a larger-bodied candle, suggesting a potential trend reversal. These functions analyze the OHLC (Open, High, Low, Close) data and return lists indicating the presence of the respective patterns.
#Defined on a candle of OHLC type that means its equivalent to a row dataframe

def scan_Engulfing(dataframe):
    alpha= 1
    beta= 0.1
    gamma= 0.1                                                                  #  Parameter controlling filter for candlestick body existence
    isEngulfing=[0]
    length  =  len(dataframe)
    close   =  dataframe['Close'].to_list()
    open    =  dataframe['Open'].to_list()
    body_differnce = [0] * (length)

    for candle in range(1,length):
        body_differnce[candle] = abs(open[candle]-close[candle])
        if body_differnce[candle]<1e-2:
            body_differnce[candle]=1e-2

        body_difference_minimum = gamma   # Ensure existence of candle body
        if (body_differnce[candle]>body_difference_minimum and                  # Ensure existence of candle body
            body_differnce[candle-1]>body_difference_minimum and                # Ensure existence of candle body
            open[candle-1]<close[candle-1] and                                  # First candle Bullish
            abs(open[candle-1]-close[candle-1])>alpha and                       # First candle body should be greater than alpha points
            open[candle]>close[candle] and                                      # Second candle Bearish
            abs(open[candle]-close[candle])> alpha*1.5 and                      # Second candle body should be bigger than previous candle
            (open[candle]-close[candle-1])> beta and                            # Ensure Engulfing
            (close[candle]-open[candle-1])>beta) :
                isEngulfing.append(2)                                           # Bearish Engulfing

        elif(body_differnce[candle]>body_difference_minimum and                 # Ensure existence of candle body
            body_differnce[candle-1]>body_difference_minimum and                # Ensure existence of candle body
            open[candle-1]>close[candle-1] and                                  # First candle Bearish
            abs(open[candle-1]-close[candle-1])>alpha and                       # First candle body should be greater than alpha points
            open[candle]<close[candle] and                                      # Second candle Bullish
            abs(open[candle]-close[candle])> alpha*1.5 and                      # Second candle body should be bigger than previous candle
            (open[candle]-close[candle-1])< -beta and                           # Ensure Engulfing
            (close[candle]-open[candle-1])<-beta) :
                isEngulfing.append(1)
        else:
            isEngulfing.append(0)

    return isEngulfing

df['is_engulfing']=scan_Engulfing(df)
df['is_engulfing'].value_counts()            # This show how many signal can be extracted form the dataframe given
Direction and Trend Detection
Additionally, the code includes functions to identify the direction of each candle and determine the overall trend based on a specified look-ahead window. Understanding the direction and trend can assist in identifying favorable trading opportunities. The direction function compares the opening and closing prices, while the trend function evaluates the relationship between the high, low, and close prices within the specified window.
def trend_scanner(dataframe, look_ahead_window):
    length = len(dataframe)
    high = list(dataframe['High'])
    low = list(dataframe['Low'])
    close = list(dataframe['Close'])
    open = list(dataframe['Open'])
    category = [None] * length

    y_delta  = 5
    for line in range (0, length-1-look_ahead_window):
        for i in range(1,look_ahead_window+1):
            if( ((high[line+i]-close[line])>y_delta ) and ((close[line]-low[line+i])>y_delta ) ):
                category[line] = 0 # no trend
                break
            elif(close[line]-low[line+i])>y_delta :
                category[line] = 2 #downtrend
                break
            elif ((high[line+i]-close[line])>y_delta ):
                category[line] = 1 # uptrend
                break
            else:
                category[line] = 0 # no clear trend
    return category

df['Trend'] = trend_scanner(df,20)
#df.head(30)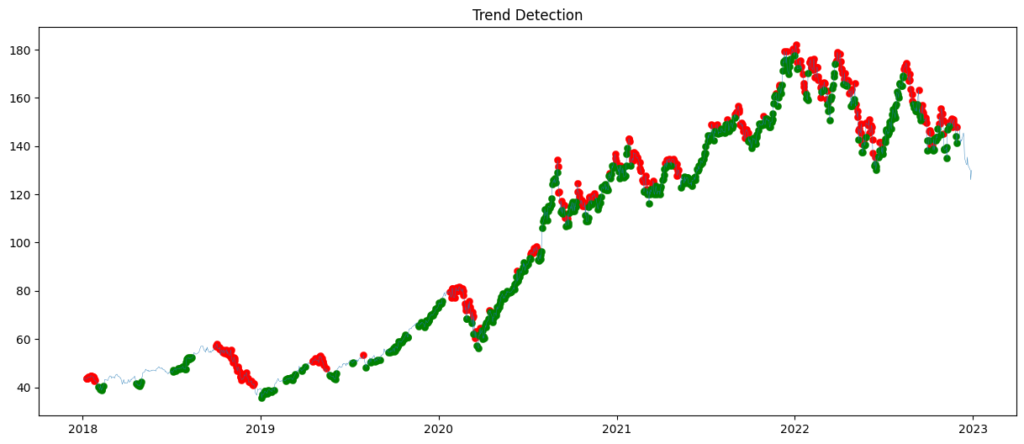
Signal Generation
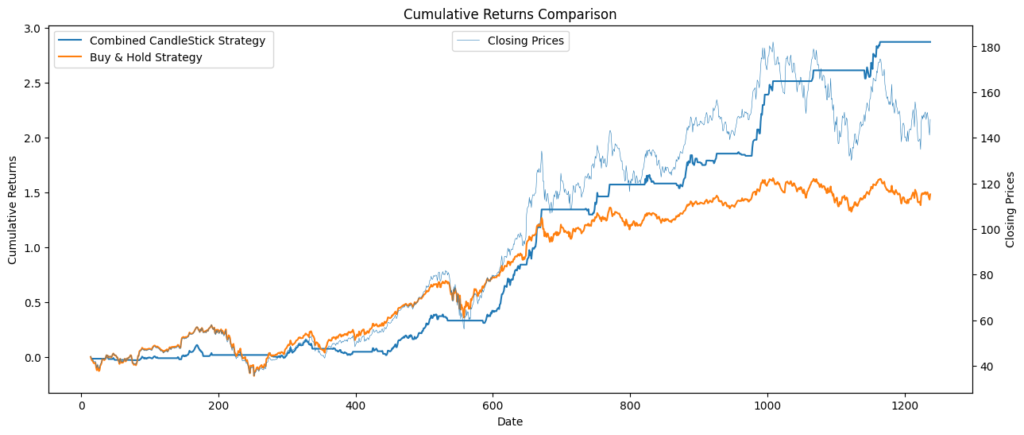
To generate trading signals, we will combine information from the detected patterns, trend direction, and RSI values (optional). The resulting signals indicate whether to buy, sell, or hold a particular stock. These signals are then used to calculate the daily returns, strategy returns, cumulative returns, and buy-and-hold returns.
Visualization and Performance Comparison
Finally, we employ the ‘matplotlib’ library to visualize the cumulative returns of the combined candlestick strategy and the buy-and-hold strategy. By comparing these strategies, traders can assess the effectiveness of the candlestick analysis approach.
Additional Candlestick Patterns
While we have covered only Engulfing and Star patterns, there are several other commonly used candlestick patterns worth exploring. These include:
- Doji: A Doji candle has a small body, indicating indecision in the market. It suggests a potential reversal or continuation depending on the preceding trend.
- Hammer and Hanging Man: These patterns feature a small-bodied candle with a long lower shadow (Hammer) or upper shadow (Hanging Man). They indicate potential trend reversals.
- Morning Star and Evening Star: These three-candle patterns occur at the end of a downtrend (Evening Star) or uptrend (Morning Star). They suggest a reversal is likely.
- Shooting Star and Inverted Hammer: These patterns feature a small-bodied candle with a long upper shadow (Shooting Star) or lower shadow (Inverted Hammer). They indicate potential trend reversals.
Frequently Asked Questions (FAQs):
Q: Can candlestick analysis be used for other financial instruments besides stocks?
A: Yes, candlestick analysis can be applied to various financial instruments, including commodities, forex, and cryptocurrencies.
Q: Are candlestick patterns always reliable indicators?
A: While candlestick patterns provide valuable insights, they should not be used in isolation. Traders should consider other technical indicators, fundamental analysis, and risk management strategies for comprehensive decision-making.
Q: How often should I update the candlestick analysis?
A: It is recommended to update the analysis regularly, depending on your trading strategy. Daily, weekly, or monthly updates are common practices.
Q: Can I automate trading based on candlestick patterns?
A: Yes, it is possible to automate trading based on candlestick patterns using algorithmic trading platforms or by developing your own trading bot.
Conclusion
Candlestick analysis is a powerful tool in a trader’s arsenal, offering insights into market sentiment and potential trend reversals. By leveraging Python and libraries such as yfinance, pandas_ta, and matplotlib, traders can implement candlestick analysis and uncover valuable trading opportunities. Remember, thorough testing and analysis are crucial before deploying any trading strategy. So, start exploring candlestick patterns, refine your trading strategies, and unlock the potential of this timeless technique.
For downloading this Juypter Notebook , you can follow this repo Trading Strategy