This article is your gateway to understanding Backtest a trading strategy based on technical indicators using Python. We’ll dive deep into the implementation of a Simple Moving Average (SMA)-based strategy, covering each step, providing reasons for their importance, and offering practical code examples.
For more such strategies, visit us at Quantified Strategies/Code
Before we get started, let’s understand why the SMA-based strategy is significant.
The SMA strategy is a cornerstone of technical analysis. It allows traders and investors to identify trends and make informed decisions based on moving averages of asset prices. The SMA-based crossover strategy, which we will explore here, is particularly popular for its simplicity and effectiveness.
Key Steps to BackTest SMA Strategy
Now, let’s delve into the critical steps of back-testing your SMA-based trading strategy:
Step 1: Import Necessary Libraries for SMA Strategy Backtest
In this initial step, we bring in essential Python libraries to handle data, perform calculations, visualize results, and access financial data sources. Here’s an example of the code:
import pandas as pd
import numpy as np
import matplotlib.pyplot as plt
import yfinance as yf
import pyfolio as pf
import warnings
warnings.filterwarnings('ignore')  # Ignore printing all warnings

# Print all outputs
from IPython.core.interactiveshell import InteractiveShell
InteractiveShell.ast_node_interactivity = "all"
These libraries provide the toolkit for data analysis, visualization, and performance assessment.
Step 2: Download OHLCV Data
Historical data is the foundation of back-testing. We rely on the Yahoo Finance Python API (yfinance) to access this data. However, there are various sources available for historical data. Here’s how you can fetch data:
# Downloading historical data for back-testing and analysis
start_date = '2015-01-01'
end_date = '2020-12-31'
ticker = 'SBIN.NS'  # Replace with your desired stock or asset
df = yf.download(tickers=ticker, start=start_date, end=end_date)
This step is crucial because your strategy’s performance analysis depends on historical price data.
Step 3: Calculate Daily Returns
Next, we calculate daily returns. This step serves as a benchmark, comparing your strategy’s performance to a simple buy-and-hold approach. The code to calculate buy-and-hold returns is as follows:
# Calculating buy and hold strategy returns
df['buy_and_hold_returns'] = np.log(df['Adj Close'] / df['Adj Close'].shift(1))
It’s essential to understand how your strategy fares against a straightforward investment approach.
Step 4: Create Strategy-Based Data Columns for SMA Strategy Backtest
Now, it’s time to set up indicators specific to your strategy. For the SMA-based strategy, we calculate three key moving averages: slow, fast, and control. Additionally, we calculate the Average True Range (ATR) for gauging market volatility. Here’s how:
#SMA indicators
slow_window = 9
fast_window = 26

# Entry and Exit SMA
control_window = int((fast_window + slow_window) / 2)

# SMA calculation
df['slow_SMA'] = df['Adj Close'].rolling(window=slow_window).mean()
df['fast_SMA'] = df['Adj Close'].rolling(window=fast_window).mean()
df['control_SMA'] = df['Adj Close'].rolling(window=control_window).mean()
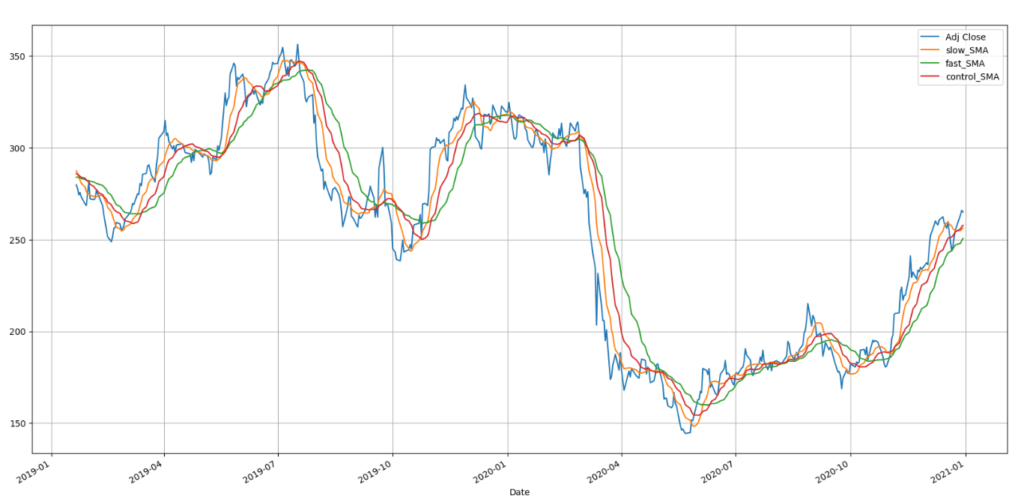
These indicators are vital for generating trading signals.
Step 5: Create Strategy Indicators
Here’s where the magic happens. In this step, we generate trading signals based on your SMA strategy. We create long and short signals and maintain positions accordingly. The code demonstrates how to set up these signals:
# Long condition
df['signal'] = np.where(
    (df['slow_SMA'] < df['fast_SMA']) &
    (df['slow_SMA'].shift(1) >= df['fast_SMA']) &
    (df['fast_SMA'] > df['control_SMA']), 1, 0)

# Short condition
df['signal'] = np.where(
    (df['slow_SMA'] > df['fast_SMA']) &
    (df['slow_SMA'].shift(1) <= df['fast_SMA']) &
    (df['fast_SMA'] < df['control_SMA']), -1, df['signal'])
Generating these signals forms the core of your trading strategy.
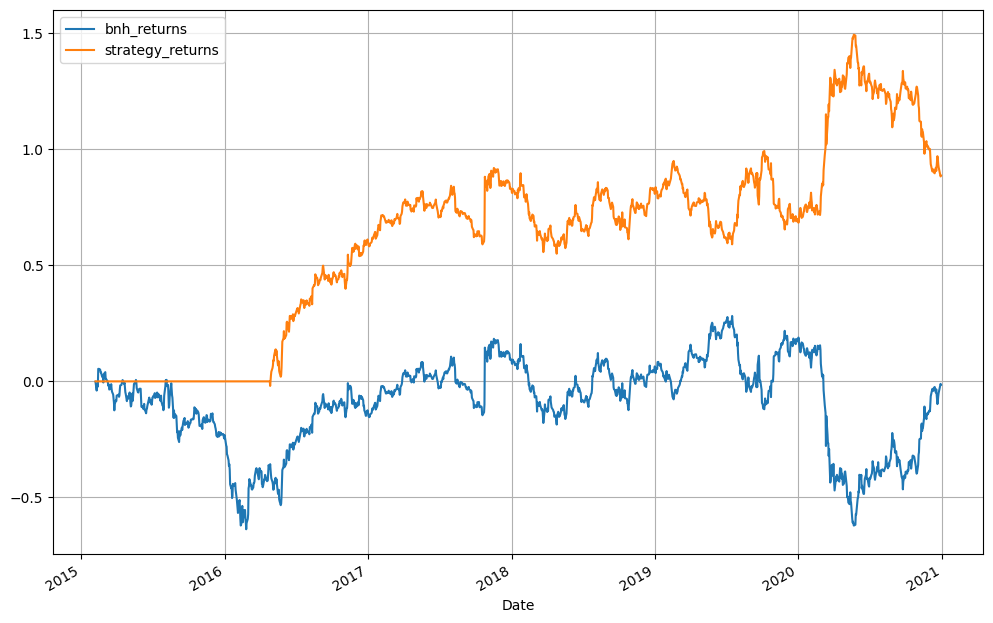
Step 6: Create Signals and Positions
In this step, we evaluate your strategy’s performance by calculating cumulative returns. By comparing strategy returns to buy-and-hold returns, we gain insights into profitability. The code below demonstrates this comparison:
# Comparing buy & hold and strategy returns
buy_and_hold_returns = df['buy_and_hold_returns'].cumsum()[-1]
strategy_returns = df['strategy_returns'].cumsum()[-1]
print("Buy and hold returns:", buy_and_hold_returns)
print("Strategy returns:", strategy_returns)

# Plotting strategy historical performance
df[['buy_and_hold_returns', 'strategy_returns']].plot(grid=True, figsize=(12, 8))

This step provides a visual representation of your strategy's historical performance.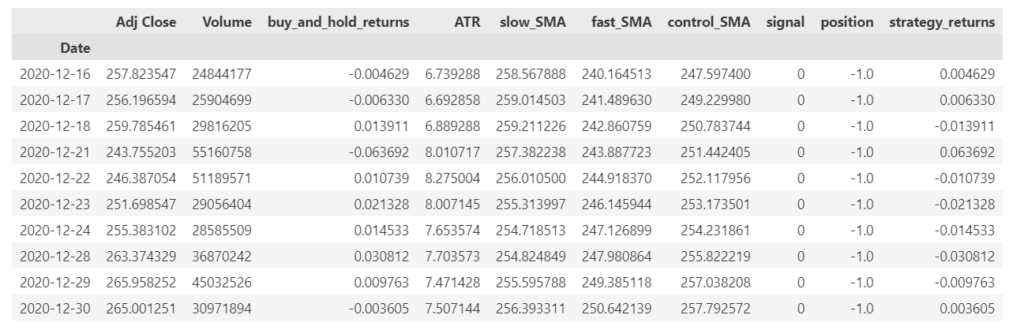
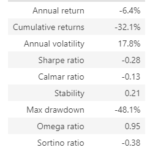
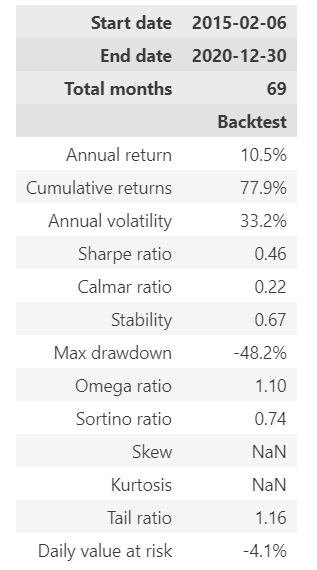
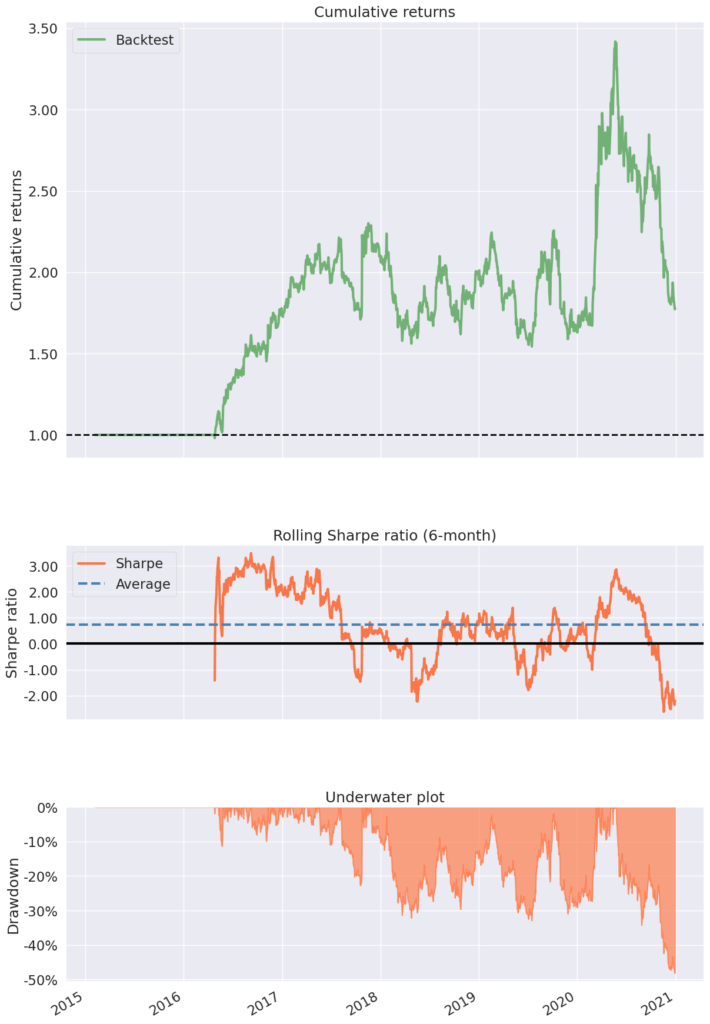
Step 7: Analyze Results Using Pyfolio
Finally, we analyze your strategy’s performance and risk using Pyfolio, a Python library designed for financial portfolio assessment. This step helps you gain deeper insights into your strategy’s strengths and weaknesses. Here’s how you can employ Pyfolio:
# Analyzing results with Pyfolio
pf.create_simple_tear_sheet(df['strategy_returns'].diff())
Pyfolio enables you to assess performance metrics, risk factors, and portfolio statistics.
Comments
In conclusion, back-testing your SMA-based trading strategy using Python equips you with valuable insights into its historical performance. While your strategy may outperform a buy-and-hold approach, it’s crucial to exercise caution when transitioning to live implementation. Factors like transaction costs and stock price momentum can introduce unforeseen risks.
To enhance your strategy’s performance, consider optimizing parameters and incorporating various technical indicators. This approach can generate more reliable signals, reduce risks, and ultimately improve overall performance. For live trading, implementing safeguards like stop-loss mechanisms and kill switches is essential to protect your investments and minimize potential losses.
By following these detailed steps and leveraging Python’s capabilities, you can embark on a journey to design, back-test, and potentially deploy a successful SMA-based trading strategy, all while optimizing for better returns and risk management.
Step 8: Risk Management and Optimization
While your SMA-based strategy may have shown promise in the back-testing phase, risk management and optimization are critical for real-world success. Here are some essential considerations:
- Position Sizing: Determine how much capital to allocate to each trade. Risk a fixed percentage of your total capital on each trade to protect against significant losses.
- Stop-Loss Mechanisms: Implement stop-loss orders to limit losses on individual trades. Define a predetermined point at which you’ll exit a losing position to prevent further erosion of capital.
- Take Profit Targets: Set profit targets to lock in gains when the market moves in your favor. This ensures that you capitalize on profitable trades and don’t let potential profits slip away.
- Portfolio Diversification: Avoid putting all your capital into a single asset or strategy. Diversify your portfolio to spread risk across different assets or strategies, reducing the impact of poor-performing positions.
- Parameter Optimization: Continuously monitor and adjust your strategy parameters based on changing market conditions. What worked well in the past may not be as effective in the future.
Step 9: Live Testing and Monitoring
Transitioning from back-testing to live trading is a crucial but challenging step. Here’s what you need to keep in mind:
- Paper Trading: Before risking real capital, consider paper trading or using a simulated trading environment to test your strategy in real time without financial risk.
- Real-Time Data: Ensure that you have access to real-time market data and execution capabilities compatible with your strategy.
- Transaction Costs: Be aware of transaction costs such as commissions, spreads, and slippage. These costs can significantly impact your strategy’s profitability.
- Emotional Discipline: Stick to your trading plan and strategy, even when facing losses or unexpected market movements. Emotional reactions can lead to impulsive decisions and trading mistakes.
- Performance Monitoring: Regularly evaluate your live trading performance against your back-tested results. Be prepared to adapt and refine your strategy as needed.
For complete code, follow us on GitHub/QuantifiedTrader/Trading_Strategies
Conclusion
In conclusion, mastering an SMA-based trading strategy using Python is a journey that involves thorough back-testing, risk management, and live trading. By following these detailed steps, you can gain valuable insights into your strategy’s historical performance, identify areas for improvement, and ultimately work towards optimizing returns and managing risk effectively.
Remember that trading involves inherent risks, and no strategy can guarantee profits. It’s essential to approach trading with discipline, continuous learning, and a commitment to risk management. With the right strategy and careful execution, you can work towards your financial goals in the dynamic world of financial markets. Good luck on your trading journey!
FAQs (Frequently Asked Questions)
What is a Simple Moving Average (SMA)-based trading strategy?
A Simple Moving Average (SMA)-based trading strategy is a technique that uses moving averages of asset prices to identify trends and generate trading signals. It involves calculating SMAs with different time windows and using their crossovers to determine when to buy or sell an asset.
Why is back-testing important for a trading strategy?
Back-testing is crucial because it allows traders and investors to assess how a trading strategy would have performed in the past. It helps identify strengths and weaknesses, provides performance metrics, and guides decision-making before deploying the strategy in live trading.
What are the key steps in back-testing an SMA-based strategy?
The key steps in back-testing an SMA-based strategy include importing necessary libraries, downloading historical data, calculating daily returns, creating strategy-based indicators, generating trading signals, evaluating outcomes, analyzing results using tools like Pyfolio, and implementing risk management techniques.
How can I optimize my SMA-based trading strategy for better performance?
You can optimize your SMA-based strategy by adjusting the time windows for your moving averages, fine-tuning entry and exit criteria, implementing position sizing rules, setting stop-loss and take-profit levels, diversifying your portfolio, and continuously monitoring and adapting to changing market conditions.
What is risk management in trading?
Risk management in trading involves strategies and techniques used to protect capital and minimize losses. It includes position sizing, stop-loss orders, portfolio diversification, and other measures to control risk exposure.
What is paper trading, and why is it recommended before live trading?
Paper trading is a simulation of real trading without risking actual capital. It’s recommended before live trading to test your strategy in a risk-free environment, gain experience, and build confidence without financial consequences.
What role does emotional discipline play in trading?
Emotional discipline is essential in trading because emotions like fear and greed can lead to impulsive decisions and trading errors. Sticking to a well-defined trading plan and strategy helps traders avoid emotional reactions.
Can trading guarantee profits?
No, trading cannot guarantee profits. All trading involves risk, and there are no guarantees of making money in financial markets. It’s essential to approach trading with caution, proper risk management, and a realistic understanding of potential losses.
What tools and resources are available for back-testing and analyzing trading strategies?
There are various tools and resources available, including Python libraries like Pandas, NumPy, and Pyfolio for data analysis and strategy evaluation. Additionally, trading platforms often offer back-testing capabilities and performance analytics.
How do I transition from back-testing to live trading successfully?
Transitioning from back-testing to live trading requires careful planning, access to real-time data, consideration of transaction costs, emotional discipline, and ongoing monitoring of performance. It’s advisable to start with a small capital allocation in live trading and gradually increase as you gain confidence and experience.