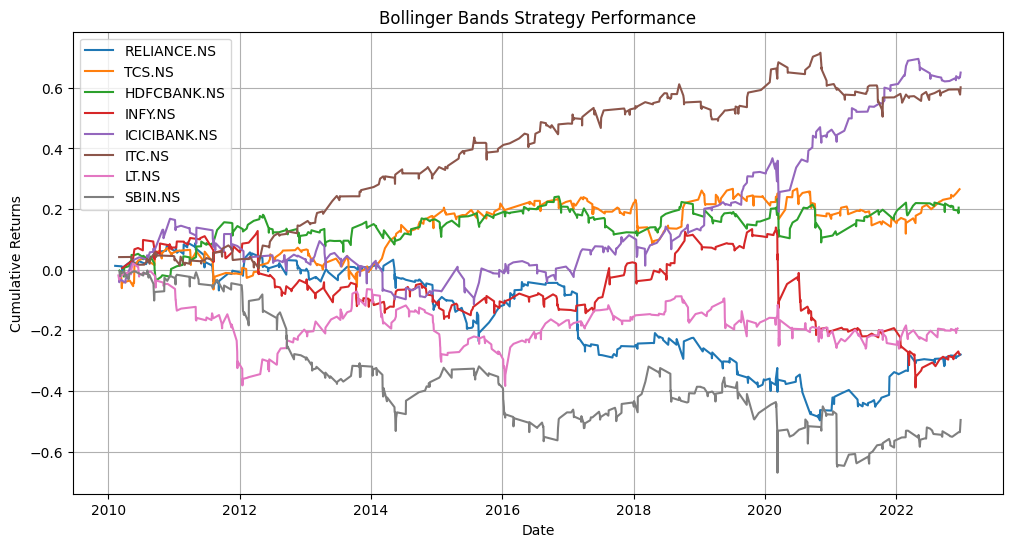
Posted inAlgorithmic Trading Backtesting Posted by By Paras Parkash 7 February 2024 Ever wondered which strategies truly worked in the past and potentially in the future? Often,…
Posted inAlgorithmic Trading Trading Strategy Understanding Bollinger Bands and Their Significance in Assessing Stock Market Performance Posted by By Paras Parkash 3 October 2023 Bollinger Bands are a popular technical indicator used by traders and investors to analyze stock…
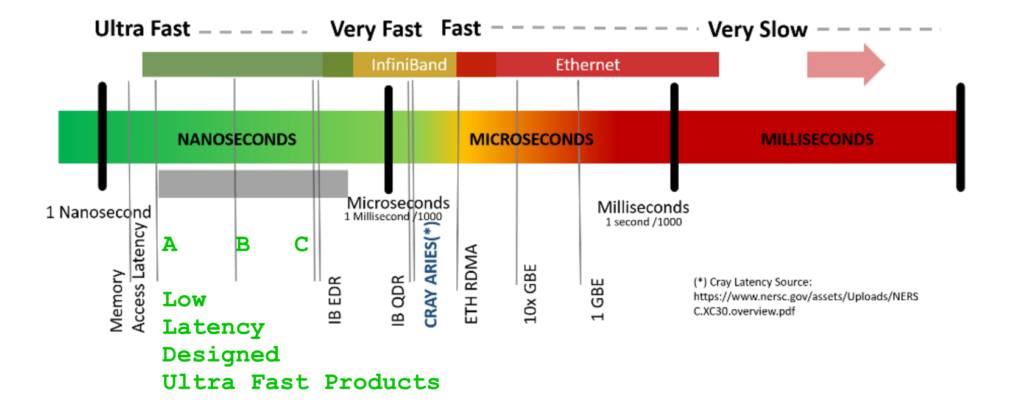
Posted inAlgorithmic Trading Understanding Latency Arbitrage: Leveraging Time Delays for Strategic Trade Execution Posted by By Paras Parkash 19 September 2023 In the dynamic realm of financial markets, where microseconds can make or break a trade,…
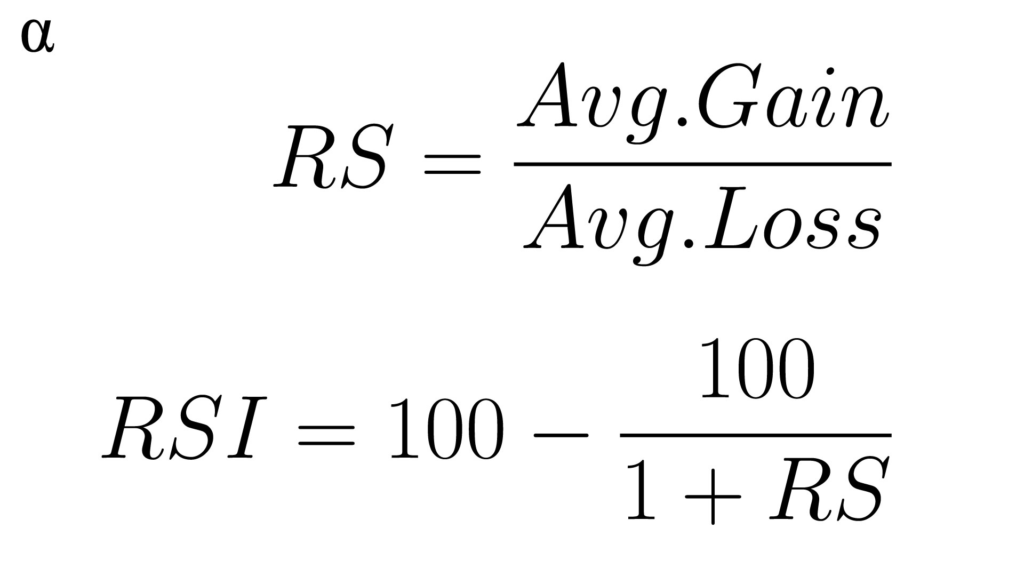
Posted inTrading Algorithmic Trading How to Backtest RSI Strategy for Trading using Python Posted by By Paras Parkash 11 September 2023 Algorithmic trading has revolutionized the financial markets, empowering traders to execute strategies with precision and…
Posted inHigh Frequency Trading Algorithmic Trading How to increase performance by 100x using FPGA (Field Programmable Gate Array) Posted by By Paras Parkash 1 September 2023 In the fast-paced world of high-frequency trading (HFT), microseconds can mean the difference between profit…
Posted inAlgorithmic Trading Understanding Co-location in Trading to Competitive Edge with Reduced Latency Posted by By Paras Parkash 4 August 2023 What is Co-location in Trading? Co-location, in the context of trading, refers to the practice…
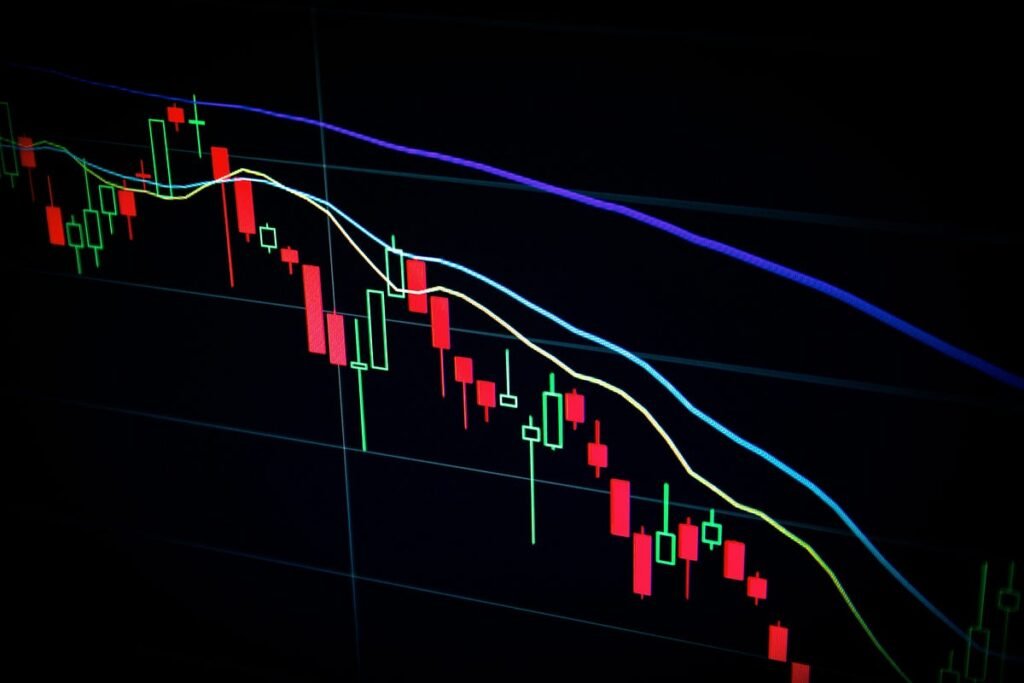
Posted inAlgorithmic Trading How to Use Candlesticks Patterns for Trading Posted by By Paras Parkash 15 July 2023 Candlestick analysis is a popular method used by traders to interpret stock price movements. By…
Posted inAlgorithmic Trading Comprehensive Guide to Trading with Trend Analysis with Python Posted by By Paras Parkash 14 July 2023 Comprehensive Guide to Trading with Trend Analysis with Python
Posted inFinancial Data Analysis Algorithmic Trading How to download Historical Stock Prices Posted by By Paras Parkash 23 May 2023 In today's digital age, accessing and utilizing data is crucial for making informed decisions, particularly…
Posted inTechnical Analysis Algorithmic Trading How to make a 15x Profit using the Rainbow Moving Average Indicator in Forex Posted by By Paras Parkash 20 May 2023 Rainbow Moving Averages (MA) is a unique technical indicator that displays multiple moving averages simultaneously…