In this article, we will walk through the functioning of a stock prediction app that utilizes Facebook’s Prophet library. The app allows users to select a stock and predict its future prices using historical data. We will provide a step-by-step guide on how the code works, and we will also explore an improved and optimized version of the code.
For downloading many more Strategies Juypter Notebook, you can follow my Github repository Econometrics_for_Quants
Table of Contents
Stock Market Prediction using FB Prophet: A Brief Overview
The FB Prophet makes predictions through the following steps:
- Trend Estimation: The model identifies the underlying trend of the time series data, which indicates its long-term behavior. It accounts for any growth or decline over time.
- Seasonality Detection: Prophet automatically detects repetitive patterns in the data, such as weekly, monthly, or yearly seasonality. It captures these patterns to make seasonal adjustments in the forecasts.
- Holiday Effects: Custom holiday effects can be added to the model to account for the impact of significant events on the time series data.
- Uncertainty Estimation: Prophet considers uncertainties in the data and provides confidence intervals for the forecasts. These intervals help understand the range within which the actual values are likely to fall.
- Forecasting: Once the model is trained, it generates future dates and makes predictions for the desired forecasting period based on the learned patterns and trends.
Using Streamlit for Building Stock Market Prediction App
Streamlit is a popular Python library that simplifies the process of turning data scripts into interactive web apps. It offers an intuitive and user-friendly interface, making it easier for data scientists and developers to showcase their Python work interactively. Here’s how Streamlit helps in building interactive applications:
- Rapid Development: Streamlit allows users to create interactive web apps with just a few lines of Python code. This speeds up the development process and reduces the need for complex web development.
- Widgets and Interactivity: Streamlit provides a range of built-in widgets like sliders, buttons, and select boxes, enabling users to add interactive elements to their apps. Users can modify inputs on the fly and observe real-time updates to visualize the results.
- Data Visualization: With Streamlit, users can seamlessly integrate various data visualization libraries, such as Plotly, Matplotlib, and Altair. This enables the creation of interactive charts, plots, and graphs to enhance data exploration.
- Customization and Theming: Streamlit offers options for customizing the appearance of the web app, such as changing colors, layouts, and themes, to match branding or personal preferences.
- Seamless Deployment: Deploying Streamlit apps is straightforward. They can be hosted on various platforms, including cloud services, making it easy to share interactive applications with others.
- Data Sharing and Collaboration: Streamlit apps can be easily shared with colleagues, clients, or the wider community, facilitating collaboration and feedback.
- Machine Learning Models Integration: Streamlit can be used to deploy machine learning models and showcase their predictions in real-time, making it useful for various predictive analytics projects.
Step-by-Step Procedure for Stock Market Prediction App using FB Prophet
- Import Required Libraries
The first step is to import the necessary libraries:
import prophet
import yfinance as yf
from prophet import Prophet
from prophet.plot import plot_plotly
from plotly import graph_objs as go
import streamlit as st
from datetime import date
The prophet library is used for time series forecasting, yfinance for fetching historical stock data, plotly for interactive visualizations, and streamlit for creating the web app. The date module is used to fetch the current date.
- Set the Date Range and Stock List
Define the date range for fetching historical stock data and create a list of stock symbols. The date range starts from January 1, 2015, up to the current date.
start = '2015-01-01'
end = date.today().strftime("%Y-%m-%d")

stocks = [
    "ADANIPORTS",
    # ... List of other stock symbols ...
    "WIPRO",
]
- Create the Streamlit App Header
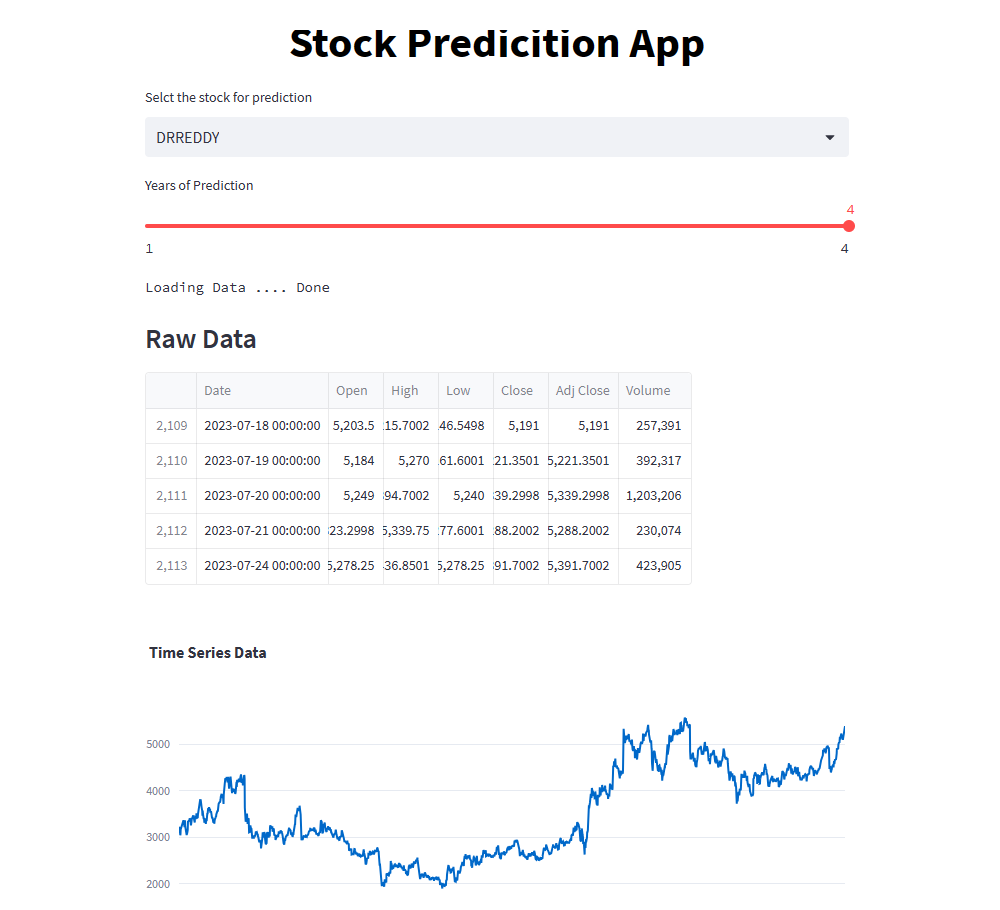
Add the Streamlit app header using Markdown to display a title for the web app. Using Streamlit widgets, allows the user to select a stock from the list and the number of years for which they want to predict the stock prices.
st.markdown("<h1 style='text-align: center; color: black;'>Stock Prediction App</h1>", unsafe_allow_html=True)
selected_stock = st.selectbox("Select the stock for prediction", stocks)
n_years = st.slider("Years of Prediction", 1, 4)
period = n_years * 365
- Fetch Historical Stock Data
Define a function to fetch historical stock data using Yahoo Finance API. The data is cached to avoid repeated downloads.
@st.cache_data
def load_data(ticker):
    data = yf.download(tickers=str(ticker) + ".NS", start=start, end=end)
    data.reset_index(inplace=True)
    return data

data_load_state = st.text("Load Data ....")
data = load_data(selected_stock)
data_load_state.text("Loading Data .... Done")
- Display Raw Data
Show the last few rows of the raw historical stock data.
You can find Free Trading Strategies and much more content on my blog quantifiedtrader.com
st.subheader("**Raw Data**")
st.write(data.tail())
- Plot the Time Series Data
Create an interactive plot using Plotly to visualize the historical stock prices.
def plot_raw_data():
    fig = go.Figure()
    fig.add_trace(go.Scatter(x=data.Date, y=data.Close, name='Stock Closing Prices'))
    fig.layout.update(title_text="Time Series Data", xaxis_rangeslider_visible=True)
    st.plotly_chart(fig)

plot_raw_data()
- Forecasting using Prophet
Prepare the data for forecasting with the Prophet. The ds column represents the dates, and the y column contains the closing prices.
Create a Prophet model and fit it to the training data.
df_train = data[["Date", "Close"]]
df_train = df_train.rename(columns={"Date": "ds", "Close": "y"})
model = Prophet()
model.fit(df_train)
prediction = model.make_future_dataframe(periods=period)
- Make Predictions and Visualize the Forecast
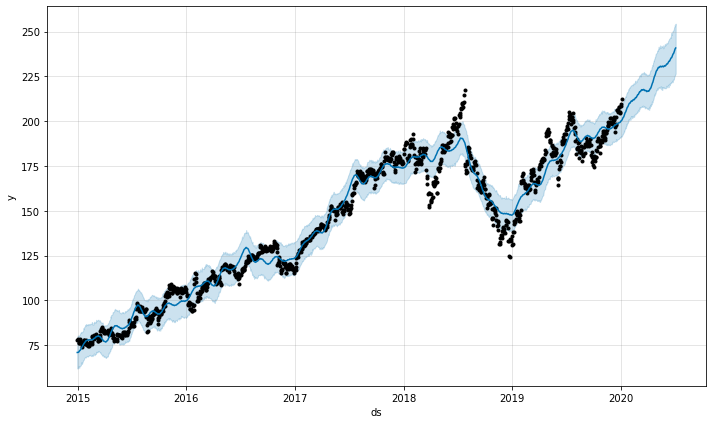
Use the trained model to make predictions for future dates and visualize the forecast.
forecast = model.predict(prediction)

st.subheader("**Forecast Data**")
st.write(forecast.tail())

st.write("**Forecast Plot**")
fig_1 = plot_plotly(model, forecast)
st.plotly_chart(fig_1)


st.write("**Forecast Components**")
fig_2 = model.plot_components(forecast)
st.write(fig_2)
FAQs about FB Prophet
Q1: What is Prophet, and how does it work? Prophet is an open-source time series forecasting library developed by Facebook’s Core Data Science team. It is designed to make accurate and scalable predictions for time-based data, such as stock prices, sales, weather, and more. Prophet is based on an additive regression model that decomposes time series data into three main components: trend, seasonality, and holidays. By analyzing these components, Prophet can make reliable forecasts and handle missing data and outliers.
Q2: How does the Prophet handle seasonality and holidays? Prophet employs a component-wise approach to handle seasonality and holidays. Seasonality refers to repetitive patterns in data that occur at regular intervals, such as daily, weekly, or yearly patterns. Prophet automatically detects and models such seasonality. It also allows users to include custom holiday effects, which are significant events that may impact the time series data, such as festivals or special days.
Q3: What is the underlying algorithm used by Prophet for forecasting? Prophet utilizes an algorithm called “Stan,” which stands for “The Stan Modeling Language.” Stan is a probabilistic programming language capable of performing Bayesian inference. The algorithm employs a variant of the Hamiltonian Monte Carlo (HMC) method, known as the No-U-Turn Sampler (NUTS). This sophisticated algorithm helps Prophet to efficiently sample from the posterior distribution, making it suitable for scalable and accurate forecasting.
You can find Free Trading Strategies and much more content on my blog quantifiedtrader.com
Conclusion
Streamlit’s simplicity and flexibility make it an excellent choice for data scientists and Python developers to create interactive web apps and effectively communicate their work to a broader audience in a visually engaging manner.


