Bollinger Bands are a popular technical indicator used by traders and investors to analyze stock price movements and identify potential trading opportunities. In this article, we will break down the code line by line to explain how Bollinger Bands work and their significance in assessing the probability of a winning trade. Additionally, we will explore the importance of the histogram of returns in evaluating the performance of a trading strategy.
For more such trading Strategies, Visit us at QuantifiedTrader
Significance of Bollinger Bands
Bollinger Bands serve several significant purposes in technical analysis and trading:
- Volatility Measurement:
- Bollinger Bands expand and contract based on market volatility. Wider bands indicate higher volatility, while narrower bands suggest lower volatility. Traders use this information to assess the level of risk associated with a particular stock or asset.
- Identification of Overbought and Oversold Conditions:
- When the price of a stock touches or crosses the upper band, it may indicate that the stock is overbought, and a price reversal or correction may be imminent. Conversely, when the price touches or crosses the lower band, it may suggest that the stock is oversold, and a potential upward reversal may occur. Traders can use these signals to make buy or sell decisions.
- Trend Analysis:
- Bollinger Bands can help traders identify the direction of a trend. When prices consistently ride along the upper band, it may indicate an uptrend, while prices hugging the lower band may suggest a downtrend. The Middle Band can act as a reference point for trend analysis.
- Reversion to the Mean:
- Bollinger Bands help traders identify potential mean-reversion opportunities. When prices move far away from the Middle Band, there is a tendency for them to revert to the mean (Middle Band). Traders may look for such opportunities to enter or exit positions.
- Confirmation of Breakouts:
- Breakouts occur when prices move beyond the upper or lower bands. Traders often use Bollinger Bands to confirm breakouts. A breakout accompanied by expanding bands may be considered more significant than one with narrow bands.
- Dynamic Support and Resistance:
- The Upper and Lower Bands can serve as dynamic support and resistance levels. Traders may use them as reference points for setting stop-loss orders or profit targets.
- Risk Management:
- Bollinger Bands provide valuable information for risk management. By understanding the width of the bands and the historical volatility of an asset, traders can adjust their position sizes and risk tolerance accordingly.
Bollinger Bands are a versatile technical indicator that helps traders assess market volatility, identify potential reversal points, analyze trends, and make informed trading decisions. They are a valuable tool for both technical analysts and traders seeking to manage risk and optimize their trading strategies.
\
Middle Band (SMA) = \frac{1}{n} \sum_{i=1}^{n} \text{Closing Price}_i
\
\
Upper Band = \text{Middle Band (SMA)} + (2 \times \text{Standard Deviation})
\
Lower Band = \text{Middle Band (SMA)} - (2 \times \text{Standard Deviation})
How to Code Bollinger Bands Trading Strategies in Python
import pandas as pd
import yfinance as yf
import matplotlib.pyplot as plt
We begin by importing the necessary Python libraries, including pandas for data manipulation, yfinance for fetching historical stock data, and matplotlib for data visualization.
# Define a function to fetch historical stock data from Yahoo Finance
def fetch_stock_data(ticker, start_date, end_date):
    df = yf.download(ticker, start=start_date, end=end_date)
    return df
Here, we define a function fetch_stock_data that takes three parameters: the stock ticker symbol, the start date, and the end date. This function uses the yf.download function from the Yahoo Finance library to retrieve historical stock data for the specified stock within the specified date range.
# Define the Bollinger Bands strategy
def bollinger_bands_strategy(df):
    # Calculate 20-day rolling mean and standard deviation
    df['SMA'] = df['Close'].rolling(window=20).mean()
    df['STD'] = df['Close'].rolling(window=20).std()

    # Calculate Bollinger Bands
    df['Upper'] = df['SMA'] + (2 * df['STD'])
    df['Lower'] = df['SMA'] - (2 * df['STD'])

    # Initialize positions
    df['Position'] = None
The bollinger_bands_strategy function calculates Bollinger Bands for a given DataFrame (df). It first computes the 20-day rolling mean (SMA) and standard deviation (STD) of the stock’s closing prices. Then, it calculates the upper and lower Bollinger Bands by adding and subtracting two times the standard deviation from the moving average. The ‘Position’ column is initialized to None to store trading signals.
# Generate trading signals
    for i in range(20, len(df)):
        if df['Close'][i] > df['Upper'][i]:
            df.at[df.index[i], 'Position'] = -1  # Short signal
        elif df['Close'][i] < df['Lower'][i]:
            df.at[df.index[i], 'Position'] = 1   # Long signal
In this section, trading signals are generated based on Bollinger Bands. If the closing price of the stock moves above the upper Bollinger Band, a short signal (sell) is indicated (Position = -1). Conversely, if the closing price falls below the lower Bollinger Band, a long signal (buy) is generated (Position = 1).
# Calculate daily returns
    df['Daily_Return'] = df['Close'].pct_change() * df['Position'].shift(1)

    return df
The function calculates daily returns by multiplying the percent change in closing price by the previous day’s trading position. These returns help evaluate the performance of the Bollinger Bands trading strategy.
# List of 10 Nifty 50 stocks
stocks = ['RELIANCE.NS', 'TCS.NS', 'HDFCBANK.NS', 'INFY.NS', 'ICICIBANK.NS', 'ITC.NS', 'LT.NS', 'SBIN.NS']
A list of 10 Nifty 50 stocks is defined, representing a diversified selection of companies in the Indian stock market.
# Define the date range for historical data
start_date = '2010-01-01'
end_date = '2023-01-01'
The date range for fetching historical stock data is specified, spanning from January 1, 2010, to January 1, 2023.
# Create a dictionary to store results for each stock
results = {}
A dictionary results is created to store the trading results for each stock.
# Fetch data, apply strategy, and store results for each stock
for stock in stocks:
    data = fetch_stock_data(stock, start_date, end_date)
    data = bollinger_bands_strategy(data)
    results[stock] = data['Daily_Return'].dropna().cumsum()
This loop fetches historical stock data for each stock, applies the Bollinger Bands strategy, and calculates cumulative returns. The results are stored in the results dictionary.
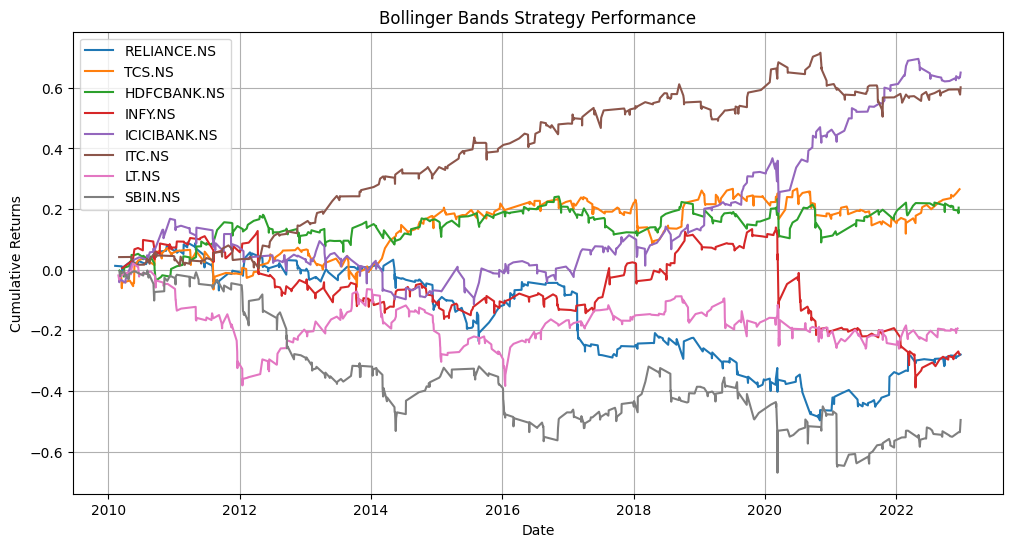
# Compare the results
plt.figure(figsize=(12, 6))
for stock, returns in results.items():
    plt.plot(returns, label=stock)

plt.title('Bollinger Bands Strategy Performance')
plt.xlabel('Date')
plt.ylabel('Cumulative Returns')
plt.legend(loc='upper left')
plt.grid(True)
A plot is generated to compare the performance of the Bollinger Bands strategy for each of the selected stocks. The cumulative returns are plotted over time, providing insight into the effectiveness of the strategy.
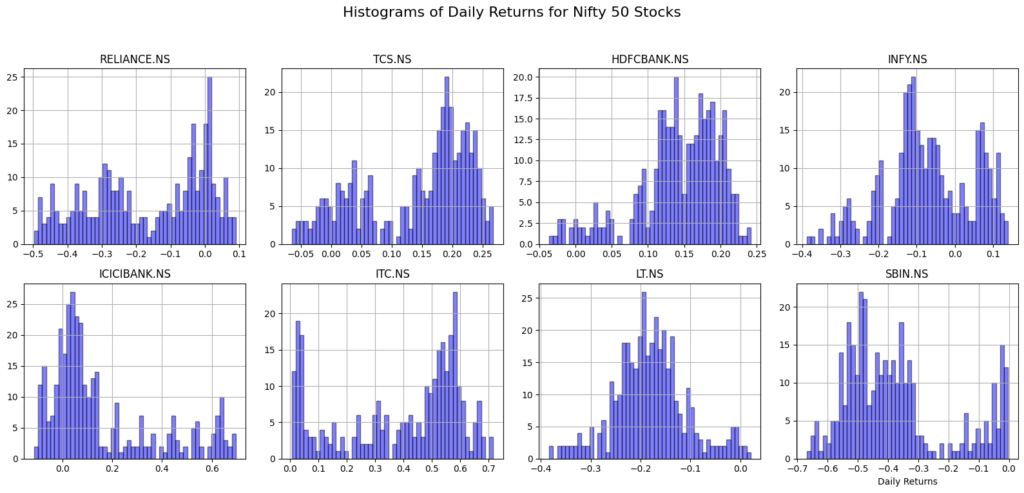
# Create subplots for histograms in a 2x4 matrix
fig, axes = plt.subplots(nrows=2, ncols=4, figsize=(16, 8))
fig.suptitle('Histograms of Daily Returns for Nifty 50 Stocks', fontsize=16)
This section creates subplots to display histograms of daily returns for each stock. The subplots are arranged in a 2×4 matrix, accommodating up to 8 stocks.
# Plot histograms for each stock
for i, (stock, returns) in enumerate(results.items()):
    row = i // 4
    col = i % 4
    axes[row, col].hist(returns, bins=50, alpha=0.5, color='blue', edgecolor='black')
    axes[row, col].set_title(stock)
    axes[row, col].grid(True)
Histograms of daily returns are plotted for each stock, providing a visual representation of the distribution of returns. The number of bins is set to 50 for granularity, and the histograms are overlaid with a blue color and black edges.
plt.xlabel('Daily Returns')
plt.tight_layout(rect=[0, 0.03, 1, 0.95])
plt.show()
Significance of Histogram of Returns in Assessing Trading Strategy:
The histogram of daily returns is a crucial tool for traders and investors to assess the performance and risk associated with a trading strategy. Here’s why it is significant:
- Distribution Analysis: The histogram provides insights into the distribution of returns. A well-behaved, symmetrical distribution suggests a consistent and predictable strategy, while skewed or fat-tailed distributions may indicate higher risk.
- Risk Assessment: Traders can assess the risk of a trading strategy by examining the spread and dispersion of returns. A wider histogram with higher volatility may signal greater risk.
- Probability Assessment: By analyzing the histogram, traders can estimate the probability of achieving specific returns or encountering losses. This probabilistic view helps in setting realistic expectations.
- Performance Evaluation: Cumulative returns can be misleading, as they do not reveal the volatility within the strategy. Histograms provide a more granular view of performance, helping traders understand the strategy’s ups and downs.
Conclusion
Bollinger Bands are a valuable technical tool for identifying potential trading opportunities based on price volatility. The code provided illustrates how to implement a Bollinger Bands trading strategy and analyze its performance using cumulative returns and histograms of daily returns. Understanding the significance of the histogram of returns is essential for evaluating the probability of success and risk associated with a trading strategy.
For Complete Code, Visit my Github Repository quantifiedtrader
Frequently Asked Questions ( FAQs)
Q1: What are Bollinger Bands?
A1: Bollinger Bands are a technical indicator used in financial analysis to assess the volatility and potential price reversal points of a stock or other financial asset. They consist of three lines: the middle line is a simple moving average (SMA), while the upper and lower bands are derived from the SMA and represent volatility levels.
Q2: How do Bollinger Bands work?
A2: Bollinger Bands works by creating an envelope around a stock’s price chart. The upper and lower bands are calculated based on standard deviations from the moving average. When the price moves near the bands, it can signal potential overbought or oversold conditions.
Q3: What is the significance of the code provided in the article?
A3: The Python code in the article demonstrates how to implement a Bollinger Bands trading strategy and evaluate its performance using historical stock data. It helps traders understand how to apply Bollinger Bands in a real-world scenario.
Q4: How can I use Bollinger Bands in my trading strategy?
A4: Traders can use Bollinger Bands to identify potential entry and exit points. For example, when the price touches or crosses the upper band, it might be a signal to sell, and when it touches or crosses the lower band, it might be a signal to buy.
Q5: What do histograms of daily returns indicate?
A5: Histograms of daily returns provide a visual representation of the distribution of returns generated by a trading strategy. They help traders assess risk, probability of win, and overall strategy performance.
Q6: Why is risk assessment important in trading strategies?
A6: Risk assessment is critical because it helps traders understand the potential downside of a strategy. It allows them to set realistic expectations and implement risk management measures to protect their capital.
Q7: What is the significance of cumulative returns?
A7: Cumulative returns show the overall performance of a trading strategy over time. They reflect the net gain or loss from the strategy and help traders assess its profitability.
Q8: How can I interpret a skewed histogram of returns?
A8: A skewed histogram suggests that returns are not evenly distributed. Positive skew indicates more frequent gains, while negative skew suggests more frequent losses. Traders should assess the implications of skewness for their strategy.
Q9: How can I apply Bollinger Bands to different stocks or assets?
A9: You can apply Bollinger Bands to various stocks or assets by fetching historical data for the specific asset and using the same Bollinger Bands strategy as demonstrated in the code, with appropriate adjustments.
Q10: Are Bollinger Bands a guaranteed predictor of stock price movements?
A10: No, Bollinger Bands are not a guaranteed predictor of stock price movements. They are a tool to help traders assess potential price volatility and reversal points, but trading involves inherent risks, and no indicator guarantees success in all market conditions. It’s essential to use Bollinger Bands in conjunction with other analysis techniques and risk management strategies.